Connecting Kinesis Analytics with AWS IoT
In a previous post, Getting started with AWS IoT and Tessel, you learned how to send temperature data from your Tessel microcontroller to an AWS IoT topic. You also learned how to set up an alarm that fires whenever the temperature goes above a certain point (in the example, 10 degree Celsius). But fixed thresholds don’t work for with dynamic datasets. If you want to receive an alert when the temperature becomes unusual, things get more complicated.
Defining the unusual
An unusual temperature needs to be defined first. Statistics can help us with the problem.
- The arithmetic mean (in colloquial language, an average) is a measure of central tendency in data (avg).
- The standard deviation is a measure that is used to quantify the amount of variation in data (sd).
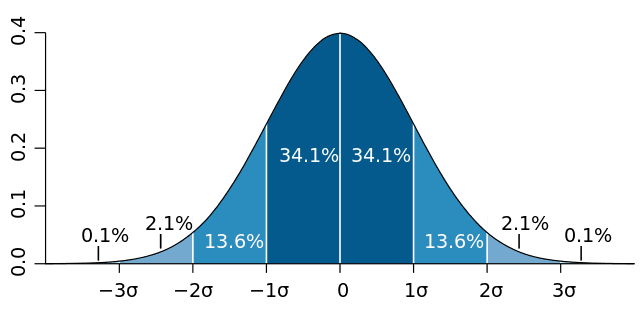
Look at the following visualization of this idea.

The idea is that most of the values are very close to the average (0 in this case).
To be more precise, 68.2% of the values are within the [avg-sd, avg+sg] range, also called 1-sigma.
To be more precise, 95.4% of the values are within the [avg-2sd, avg+2sg] range, also called 2-sigma.
So 4.6% of the values are not within the 2-sigma range. We will define them as unusual values.
Excursion: My first job was in high frequency / algorithmic trading. I did a lot of real-time analytics on top of financial markets data like fx, stock, futures, and options prices. So let me explain the idea of averages in more detail.
The average applies to normally distributed data sets like you see in the above figure. Many phenomena in nature are bell shaped/normally distributed, e.g. size of humans.
If you apply the average to numbers like personal incomes of the people of a country, things get funny. Assume we have 100 people in our country. 99 people earn $100 while the leader makes $10,000. The average is $199. The standard deviation is $990. So an income of $10,000 is ~ a 10-sigma event. If you wait for a 7-sigma event once a day you will see one every 1.07 billion years (a quarter of Earth’s history). A 10-sigma event is impossible. Still, it’s in the data. The issue is that the data is not normally distributed.
The crux of all that is that we are usually interested in outliers while most statistics focus on the opposite. Some people even remove outliers from their data to make it normally distributed.
In our temperature example we assume a normal distribution but keep in mind that this assumption is most likely not true. You will not end up with 4.6% unusual temperatures!
Let’s do some math:
temperatures = [15, 10, 11, 12, 14, 13, 14, 15, 9, 12] |
We define that a temperature is unusual, if it is not in the 2-sigma range of past values.
temperature < (avg - 2*sd) |
This works pretty well for static data sets. But in our case, new temperature data arrives every minute.
Sliding windows
What we like to do is compare the current temperature against the average and standard deviation of temperature over that past one hour. This is called a sliding window because old values fall out. You add new values on the front while old values fall out on the end after 1 hour.
Let’s do some math:
temperatures = [...] |
So we can define that a temperature is unusual if it is not in the 2-sigma range of values that are not older than 1 hour.
temperature < (avg - 2*sd) |
Implementation
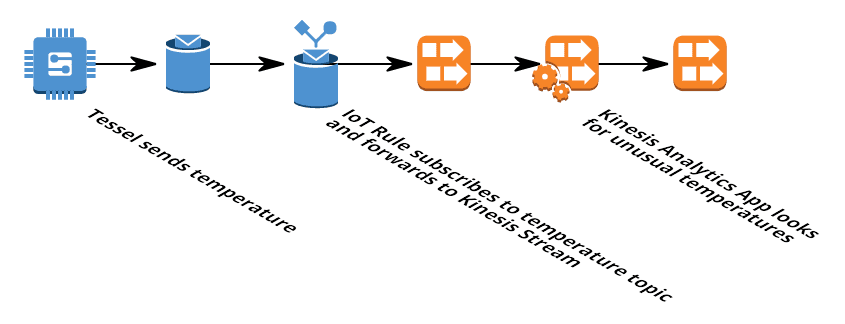
To implement this, we are going to pipe all temperatures from the IoT topic temperature into a Kinesis Stream. A Kinesis Analytics application will connect to that stream and run the analytics logic to calculate averages and standard deviations over sliding windows. Finally, the Kinesis Analytics application writes the unusual temperatures back into a Kinesis Stream. The following figure demonstrates the flow of data.

Let’s get started! Log in to the AWS Management Console.
You need to setup the IoT example as described in Getting started with AWS IoT and Tessel.
Creating the Kinesis Streams
First, we need to create two Kinesis Streams. One for the raw temperature data (input) and one for the unusual sensor data (result).
- Open the AWS Kinesis Management Console
- Click Go to Streams button
- Click Create Stream button
- Set the Stream Name to
temperature - Set the Number of Shards to
1 - Click Create button
We need a second stream for the results.
- Click Create Stream button
- Set the Stream Name to
unusual-temperature - Set the Number of Shards to
1 - Click Create button
Creating the IoT Rule
Now it’s time to pipe the data from AWS IoT into the temperature Kinesis stream.
- Open the AWS IoT Management Console
- Click Create a resource button
- Click Create a rule
- Set Name to
forward_temperature - Set Description to
Forwards temperature to Kinesis Stream where it is analyzed - Defining the message source
- Set SQL version to
2016-03-23-beta - Set Attribute to
temperature - Set Topic filter to
temperature - Defining the action
- Set Choose an action to
Send message to a real-time data stream (Amazon Kinesis) - Set Stream name to
temperature - Set Partition key to
${topic()} - Click Create a new role
- Set Role name to
forward-temperature - Click Create button
- Click Add Action button
- Click Create button
Creating the Kinesis Analytics Application
You have temperature data coming in so we can start to analyze the data. A Kinesis Analytics application consists of three parts:
- Source: The Kinesis Stream
temperature - Real-time analytics: SQL to analyze the data
- Destination: The Kinesis Stream
unusual-temperature
But first, you need to create the application.
Kinesis Analytics is not covered by the free tier. This experiment will cost you a few dollars!
- Open the AWS Kinesis Management Console
- Click Go to Analytics button
- Click Create new application button
- Set Application name to
unusual-temperature - Set Description to
Analyze temperature for unusual values - Click Save and continue button
Creating the Source of the Application
- Click Connect to a source button
- Select the
temperaturestream - Set Permission to access the stream to
Create/update unusual-temperature IAM role
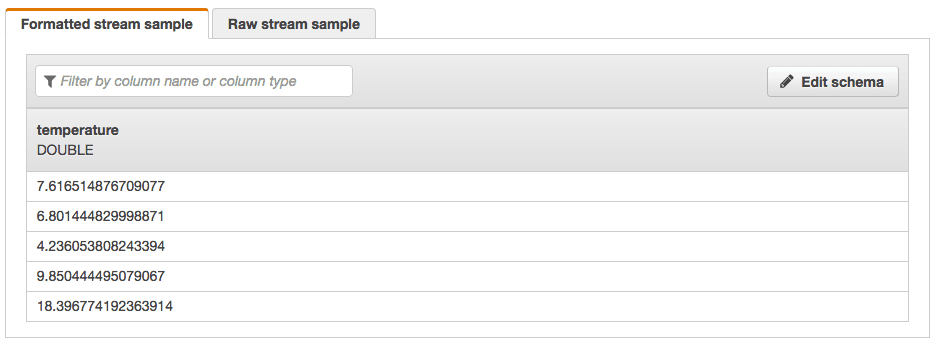
The schema is discovered now. This only works if new data arrives and should look like this:

- Click Save and continue button
Creating the Real-time analytics logic of the Application
- Click Go to SQL editor button
- Click Yes, start application button
- Wait 30-90 seconds until your application is started…
- Insert the following SQL:
CREATE OR REPLACE STREAM "temperature" ("temperature" DOUBLE, "temperature_avg" DOUBLE, "temperature_sd" DOUBLE); |
- Click Save and run SQL button
- Saving and running SQL will take some time…
- Inspect what’s going on by selecting the In-application stream
temperature. You should see new values coming in every minute together with the average and the SD of the last hour. - Click Exit (done editing)
Creating the Destination of the Application
- Click Connect to a destination button
- Select the
unusual-temperaturestream - Set Output format to
JSON - Set Permission to access the stream to
Create/update unusual-temperature IAM role - Click Save button
Consuming the unusual sensor data from the Kinesis stream
Unfortunately we can not connect a Kinesis stream with a SNS topic directly to send out the alert. But you can create a Lambda function that connects to the unusual-temperature stream and forwards the values to SNS. This is out of the scope of this post. You can also have a look at the In-application stream DESTINATION_SQL_STREAM.
Summary
- We used AWS IoT to ingest sensor data into our system over MQTT. AWS IoT runs rules to subscribe to topics and trigger action like writing to a Kinesis Stream.
- You can analyze real-time data with Kinesis Analytics. A Kinesis Stream is used as the source and destination of the analytics.
- Kinesis Analytics make use SQL to query the real-time data stream.
- Sliding windows can be used to calculate aggregation over the last hour of data
Clean up
Make sure to clean up the example after you are finished. Otherwise additional charges will apply.
- Delete the Kinesis Analytics Application
- Delete the two Kinesis streams
