CloudWatch is neglected: Why is the control room empty?
CloudWatch is the most undervalued service on AWS. It’s like an empty control room. All data is there, but no one is looking at it.

Together with IAM and VPC, CloudWatch provides the basis for modern infrastructure. CloudWatch combines an extensive set of functionality that could also be divided into three dedicated services: Metrics, Logging, and Events. Let me explain why you should take CloudWatch more serious and make use of your control room.

Metrics
A metric represents a time series such as CPU utilization, network usage, or AWS costs. A metric stored numeric data together with a time-stamp. Most AWS services report data to CloudWatch where it is aggregated by the minute and persisted. You can retrieve the minute-by-minute data, or you can retrieve statistics such as 10-minute sum, 1-day average, but also 1-hour 99% percentile.
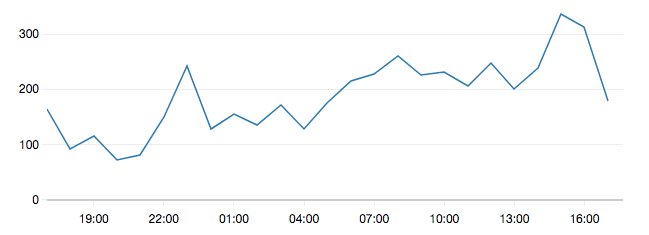
The CloudWatch Management Console provides a graphical way to represent metrics in charts. The following figure shows such a chart.

Besides many AWS services that send data to CloudWatch, you can also send your data which is stored in so called custom metrics. A custom metric is similar to the provided AWS metrics; the only difference is that you sent the data (e.g. using an SDK or the CLI).
The first 15 days, CloudWatch keeps the minute-by-minute data. The next 48 days, CloudWatch keeps a resolution of 5 minutes. The next 392 days CloudWatch keeps a resolution of 1 hour. After that (455 days in total) the data is deleted.
Available statistics are:
- SampleCount: Number of data points (actual value does not matter)
- Average
- Sum
- Minimum / Maximum
- Percentile (values between p0.0 and p100)
- p0.0 should be the Minimum
- p50 should be the median
- p100 should be the Maximum
Looking at charts can be helpful, but you may also want to automate this process.
Alarm
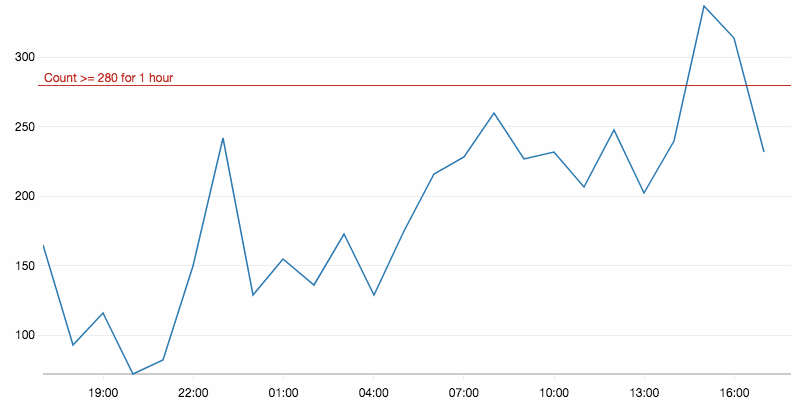
A CloudWatch Alarm observes a metric. As soon as the metric (or a statistic of the metric) crosses a threshold, the alarm triggers an action. One popular action is to send a message to an SNS topic. You can subscribe to the topic via email to get notified if an alarm is triggered. You can also trigger a scale-up action to react automatically to capacity shortages or execute more sophisticated logic in a Lambda function.
A basic alarm is shown in the following figure.

When defining an alarm, you can also set more sophisticated rules than just a threshold. For example, you can specify that the threshold must be reached multiple times in a row and how missing data should be interpreted. Imagine a machine that sends a custom metric, when this machine breaks, the metric is no longer published which should be an error. On the other hand, you may only publish a metric if something happens, where no data means 0.
Back to visuals. Humans are good at finding patterns in data. Let’s explore better ways to visualize metrics.
Dashboard
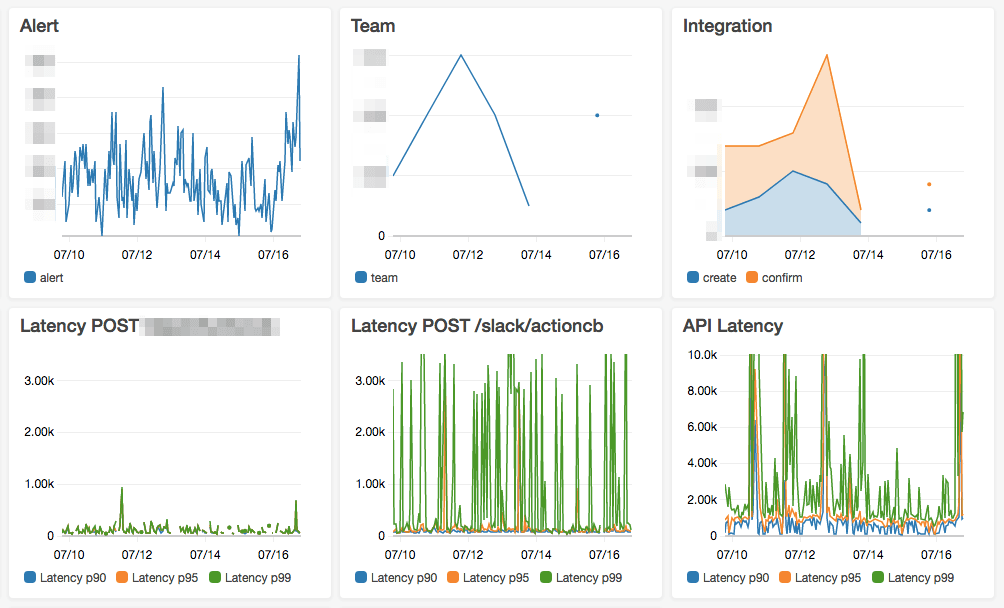
So many metrics are stored in CloudWatch. But only a few of them matter to you. Why not keep the most important metrics in one place? This place can be shared across your team. Your team can get more visibility into the running infrastructure which is a real motivation to feel responsible. A CloudWatch Dashboard is a board with 24x24 tiles that you can fully configure to display CloudWatch metrics. You can either display the latest value of a metric, a simple line graph of one or more metrics, or a stacked area graph of multiple metrics. All metrics display the same time range. The following figure shows one of my dashboards.

I used a combination of custom metrics, and AWS provided metrics. Together with line graphs and stacked area charts.
Good news: CloudFormation now also support the creation of CloudWatch Dashboards!
Logs
CloudWatch Logs is a place to store and index all your logs. You can use the CloudWatch Logs Agent to stream the content of log files on your EC2 instances right into CloudWatch Logs. Logs are grouped in so called Groups, inside a group, multiple Streams capture the actual log data. You can define a retention period for a log group to delete log files if they age.
You can search a log group using full-text search but also more structured queries if you know the structure of your logs.
Wouldn’t it be nice if you could observe your logs automatically?
Metric Filter
You can define a Metric Filter using a search query that is applied to all incoming log data. If the query matches a log line, a custom metric is incremented for you. I hope you see how the loop is closed? Define an alarm on the custom metric on you can get alerts if a log line matches your search query.
Subscription Filter
Sometimes, metric filters are not powerful enough. If you need to execute more sophisticated logic, you can subscribe to a log group. Each entry that matches the query:
- invokes a Lambda function
- is stored in a Kinesis stream. You can analyze the stream with the Kinesis Client Library or Big Data Tools like Spark
- is stored in a Kinesis Firehose. Firehose can deliver to S3 or ElastiSearch where you can use different tools to analyze the data
Events
Your AWS infrastructure changes always. Resources are added and removed. CloudWatch Events provide a way to react to such changes. It provides an event stream of your AWS account where many AWS services publish events. E.g. EC2 publishes an event when an instance state changes (e.g. from running to terminated), the Management Console publishes Login events, and much more.
You may ask how this is different to CloudTrail? CloudWatch Events are much faster. CloudTrail records all API activity on your AWS account but only guarantees to deliver once every 15 minutes.
Like custom metrics, you can also publish custom events.
Rule
A CloudWatch Event Rule is similar to an alarm. The rule defines what kind of events you are interested in and what action is triggered if an event arrives that matches the condition. You can again send a message to an SNS topic, but also trigger a Lambda function to execute more serious logic.
Bus
A CloudWatch Event Bus is the most recent new feature of CloudWatch. Now you can receive events from another AWS account. The sender account creates a rule to forward the events to the account that owns the bus. Buses make sense in a multi-account setup.
Notifications & Escalations
As soon as a CloudWatch Alarm or Rule is triggered, you are on your own. No AWS service can help you to manage alerts that your infrastructure is firing. Sending all those alerts via email is not very sustainable. Not a single person should be responsible for closing alerts. Also, an email list will drive you crazy: The whole team will be interrupted on each alert. What you need is a clever way to distribute the alerts across your team while minimizing the time it takes to close an alert. One solution to this problem is our chatbot marbot. marbot ensures your small team never misses an alert from Amazon Web Services. If your team is not small, you may want to look at OpsGenie or PagerDuty.
Summary
CloudWatch provides insights into your running infrastructure.
- Metrics are published by AWS services or by your applications. They can contain all kinds of numeric values attached to a time-stamp.
- Alarms observe metrics and trigger actions if a threshold is reached
- Dashboards visualize a set of metrics
- Logs store and index your log files in a central place
- Filters run a continuous query on your logs and trigger actions if a match is found
- Subscription Filter provide a way to forward logs to other services for analytics like Kinesis or Lambda
- Events provide a near real-time stream of changes in your AWS account
- Rules trigger actions if an event matches a pattern
- Buses can receive events from other AWS accounts
- Notifications & Escalations are not handled by CloudWatch. You need a 3rd party solution
I hope that you are sitting inside your AWS control room now and see its value.
Special thanks to @flomotlik and @s0enke for reviewing this blog post.
