AWS CloudWatch Dashboard Cost Efficiency: Logs vs. Custom Metrics
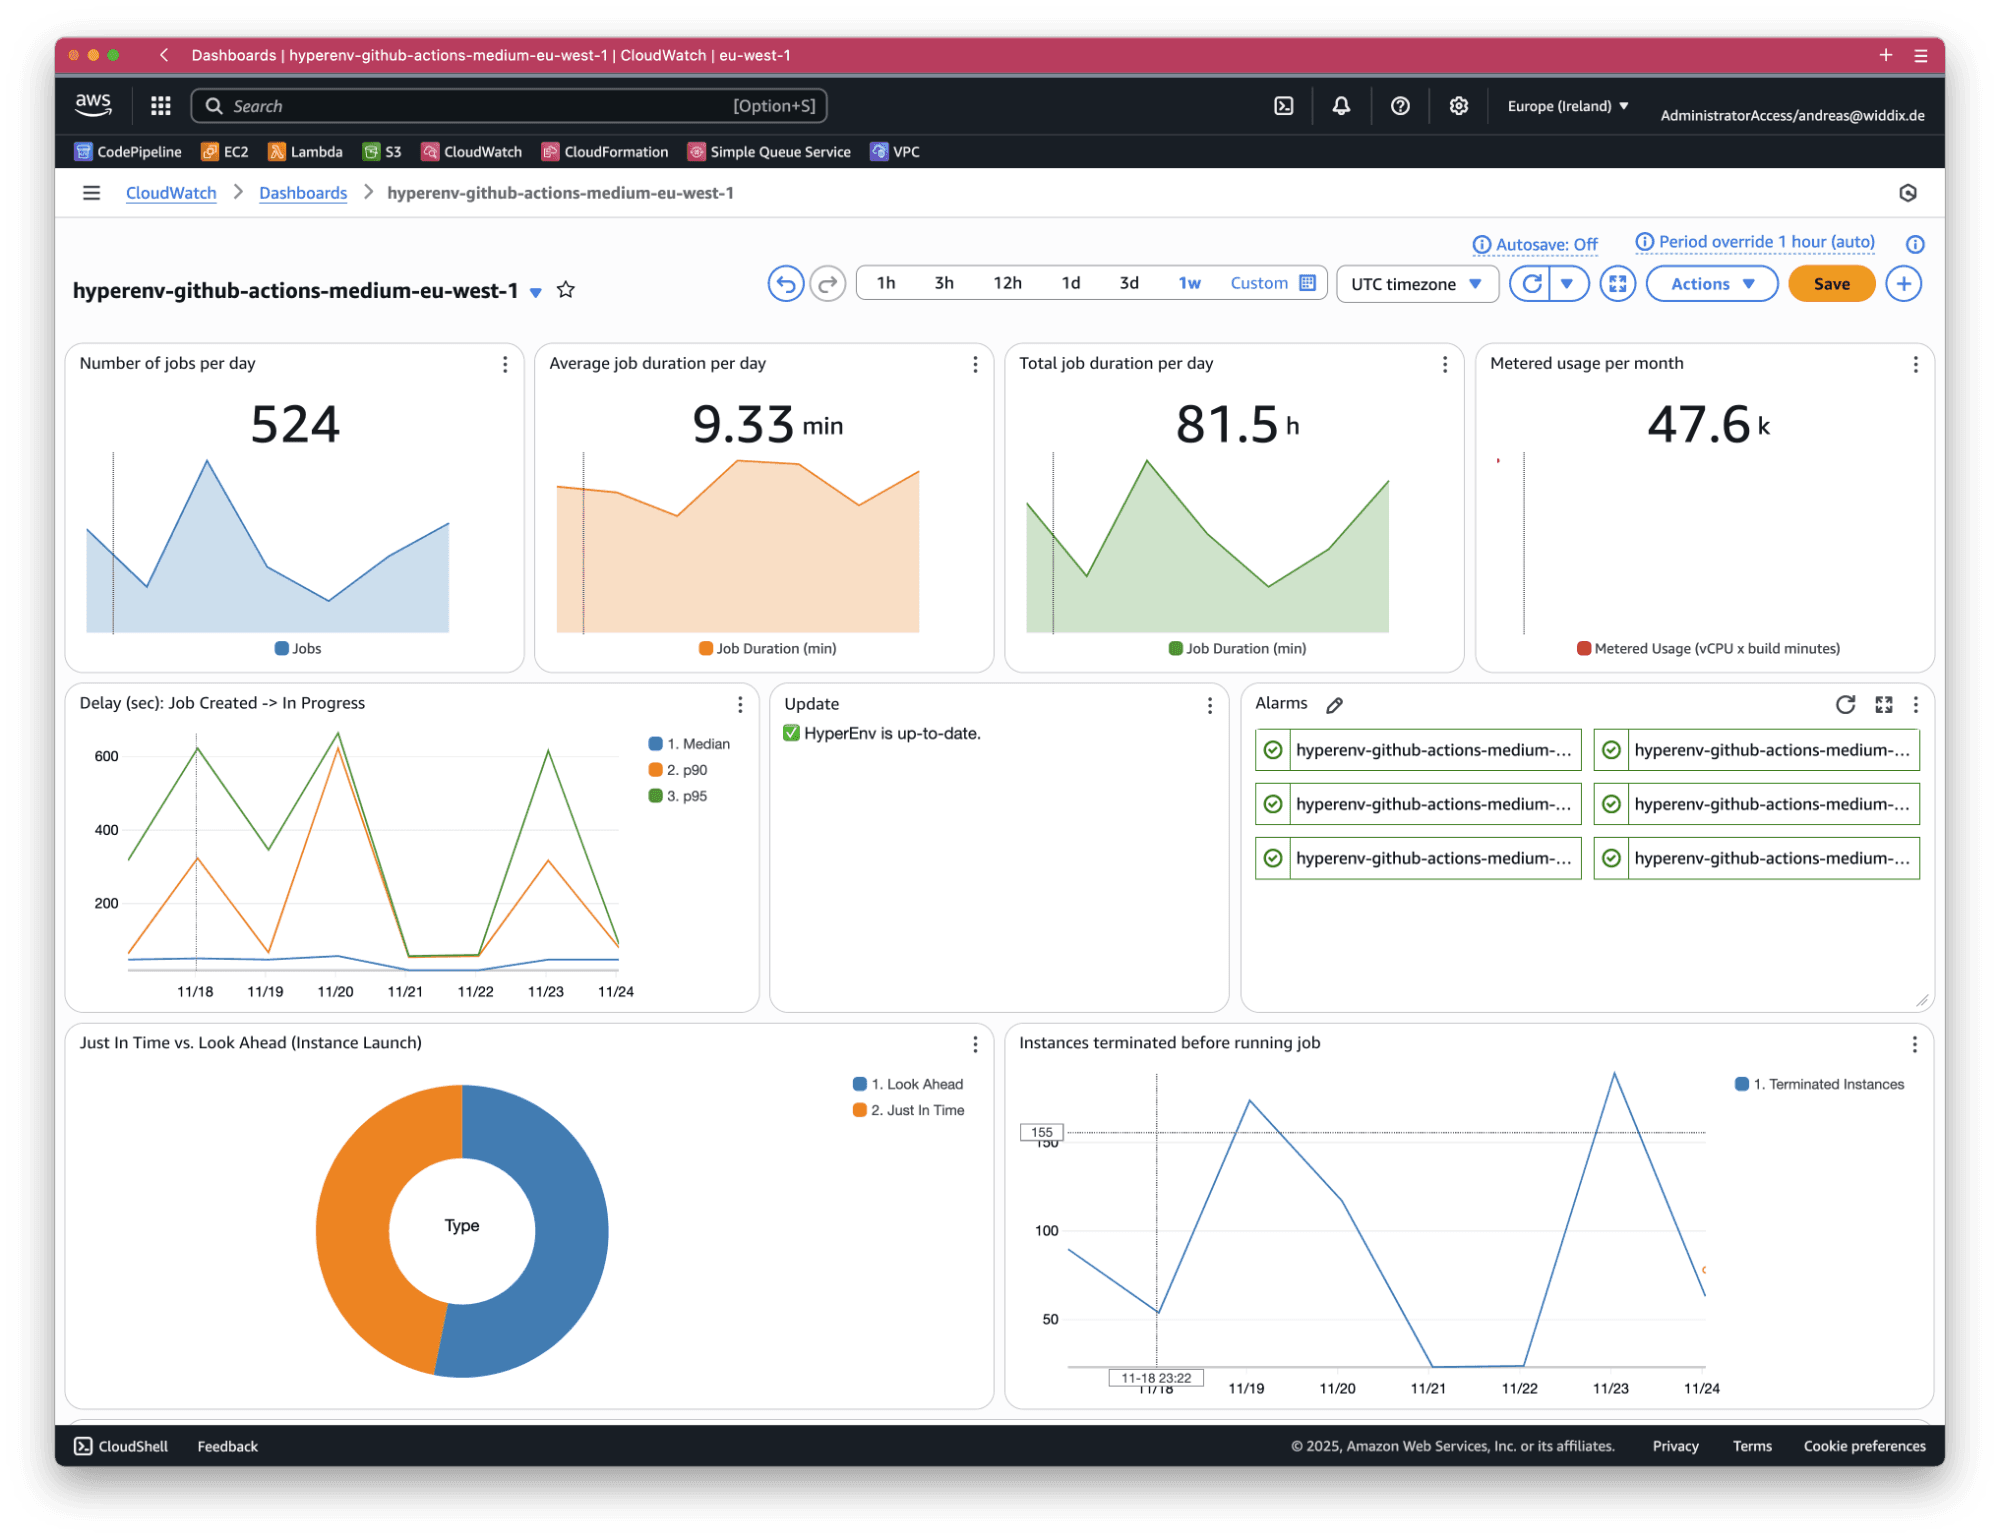
Setting up a CloudWatch dashboard is a great way to share insights into the state of a system. Recently, I was working on improving the dashboard for HyperEnv, our solution to deploy and manage self-hosted runners for GitHub Actions on AWS. Up until now, we used custom metrics to collect data from the system and display it on the dashboard. However, I was somewhat annoyed by the high costs of this approach. Therefore, I was looking for a cost-effective alternative.

Important to know, a CloudWatch dashboard supports the following internal data sources out of the box:
- CloudWatch metrics
- CloudWatch logs
- CloudWatch alarms
The possibility to add charts not based on metrics but on logs to a dashboard caught my attention.

First, I did the math to compare the costs between custom metrics and logs.
CloudWatch custom metrics pricing example
AWS charges $0.30 per custom metric per month.
Moreover, AWS charges $0.01 per 1,000 PutMetricData requests. Let’s assume we want to record a metric value every 30 seconds.
2 * 60 * 24 * 30 = 86,400 PutMetricData requests per month = $0.86 per month |
That’s $0.86 for ingesting metric data per month.
When displaying custom metrics on a dashboard, AWS charges for the GetMetricData or GetMetricStatistics requests. We assume 100 requests per day.
100 * 30 = 3000 requests per month = $0.03 per month |
So, we pay an additional $0.03 per month to display the metric per month.
In total, my estimation is a charge of $1.19 per custom metric per month.
Let’s compare the costs of custom metrics with logs next.
CloudWatch logs pricing example
Instead of using custom metrics, we send structured log messages to CloudWatch. For example, the following log message includes an event type and a value.
{event:'CUSTOM_METRIC_1',value:10} |
For the following pricing example, let’s assume each metric data message consumes about 60 bytes of storage. AWS charges $0.50 per GB (us-east-1) for ingesting data.
2 per minute * 60 minutes * 24 hours * 30 days * 60 bytes = 0.005 GB per month = $0.0025 per month |
In summary, data ingestion costs $0.0025 per metric and month.
Additionally, AWS charges $0.005 per GB of data scanned when querying the data. Let’s assume that the CloudWatch dashboard displaying information about the metric executes 100 CloudWatch Logs Insights queries per day and fetches data from the past 30 days.
30 days * 100 queries * 0.005 GB = 15 GB scanned data per month = $0.075 per month |
Use field indexes to ensure each query is only scanning relevant data.
So the cost for querying the data is $0.075 per month.
In total, my estimation is a charge of $0.0775 per metric and month.
Note that using logs to display metrics on a dashboard is 93% cheaper than using custom metrics.
Pros and Cons
First, defining CloudWatch alarms to trigger automated actions like scaling out or in or to notify operators requires CloudWatch metrics. Using CloudWatch logs to collect and query metrics is a possible option when the data is needed to be analyzed on-demand, for example, to build a dashboard.
Second, dashboard widgets based on CloudWatch metrics load much faster than those relying on a CloudWatch logs query. It takes about 1 second to load a widget based on a custom metric and 5 to 10 seconds to load a widget based on a logs query.
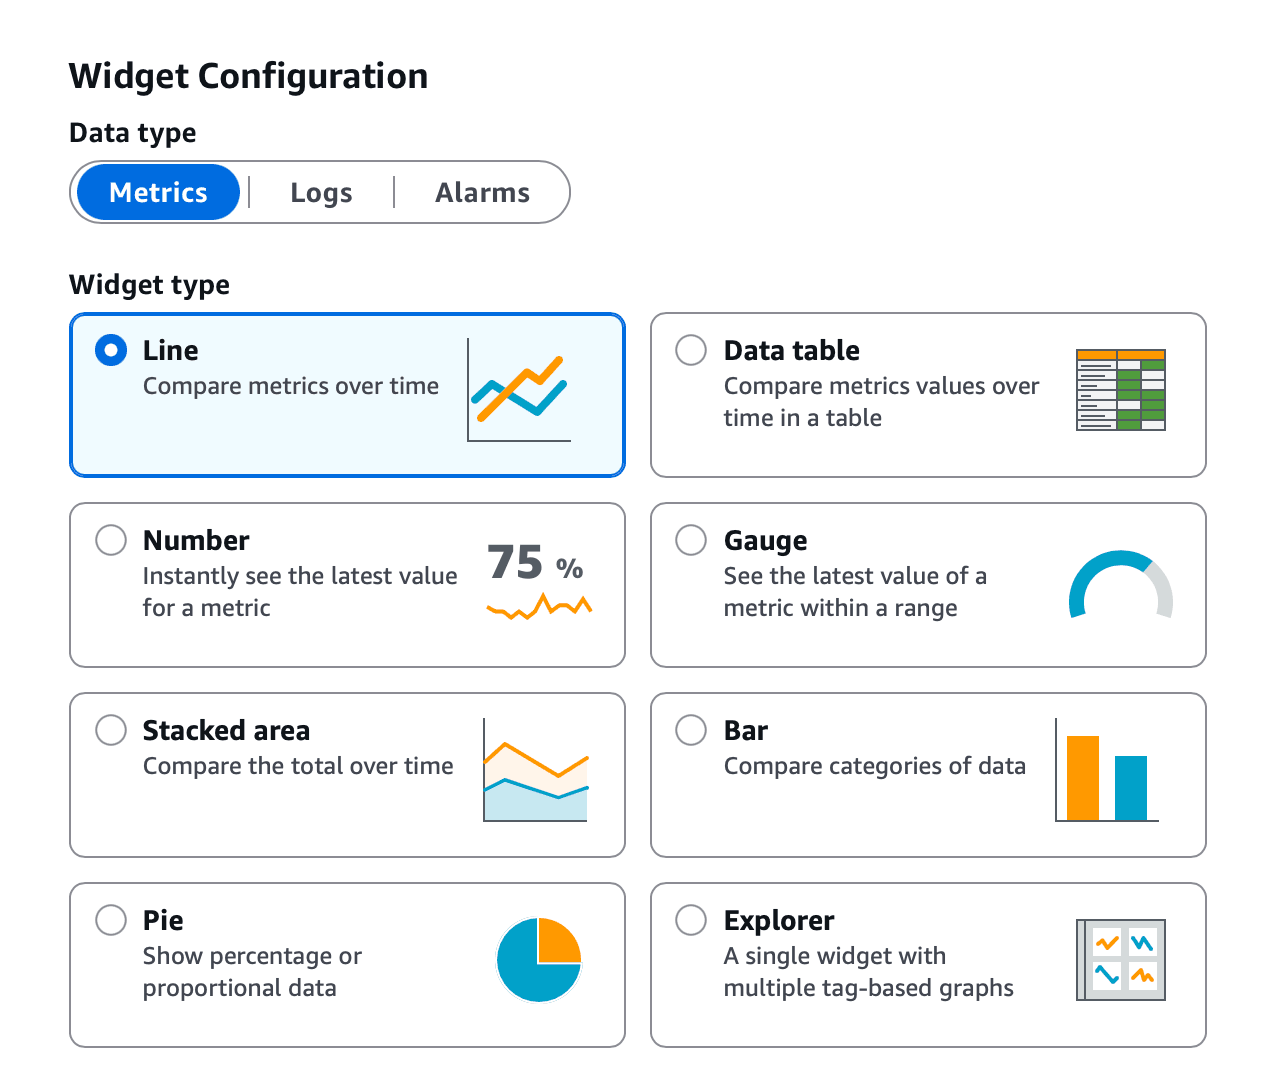
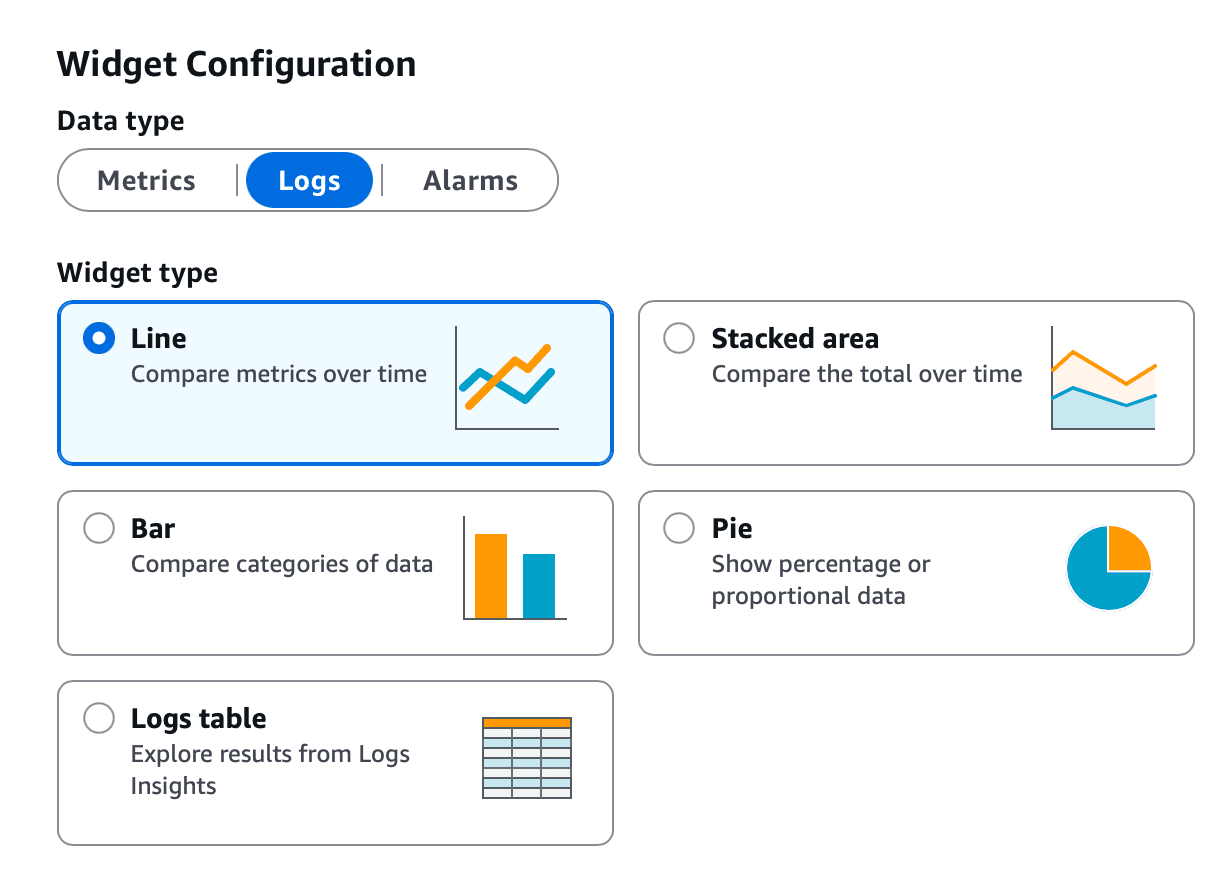
Third, the available widget types for CloudWatch dashboards differ based on the data type.
The following screenshot shows the available widgets for CloudWatch metrics.

In contrast, the next screenshot shows the available widgets for CloudWatch logs.

Fourth, the query language to evaluate data differs between metrics and logs. A math expression allows you to combine multiple metrics, for example.
The following snippet shows a math expression to calculate the total network throughput of a NAT gateway.
(BytesInFromDestination+BytesInFromSource+BytesOutToDestination+BytesOutToSource) |
In contrast, CloudWatch Logs Insights allows you to analyze metric data stored in log groups. Three different query languages are supported.
- Logs Insights QL
- PPL
- SQL
The following example shows a query, that fetches the median, p90, and p95 from log messages grouped by day.
SELECT window.start, approx_percentile(`message.diffStartInProgress`, 0.50) AS `Median`, approx_percentile(`message.diffStartInProgress`, 0.90) AS `p90`, approx_percentile(`message.diffStartInProgress`, 0.95) AS `p95` FROM `logGroups(logGroupIdentifier:['/aws/lambda/***'])` WHERE `message.eventId` = 'JOB_IN_PROGRESS' GROUP BY window(`@timestamp`, '24 hours') |
Summary
Collecting and analyzing metric data with CloudWatch logs is a cost-effective alternative to using custom metrics. The approach comes with a few drawbacks. For example, it is not possible to automate actions or send notifications based on logs out-of-the-box. However, building a dashboard to provide insights into key metrics is definitely possible with data stored in log groups instead of custom metrics.
