AWS Monitoring Primer
Monitoring is critical for a secure, high-performing, resilient, and efficient cloud infrastructure. This blog post summarizes all the bits and pieces you need to think of when monitoring your AWS account.

Overview
The following mind map provides an overview of monitoring goals as well as all services and features related to monitoring:
- Amazon CloudWatch Events: subscribe to notifications from your AWS infrastructure.
- Service Specific Events: subscribe to notifications from specific services (partially legacy).
- Amazon CloudWatch Metrics: get insights into the utilization and condition of your resources.
- Amazon CloudWatch Alarms: define alarms based on metrics to get notified about incidents or resolve problems automatically.
- Logging: search and analyze logs from AWS services or your applications.
- Amazon Simple Notification Service (SNS): deliver notifications from your AWS infrastructure to responsible persons or teams.
- Dashboards: get an overview of your system’s status.
Note that I will not cover any 3rd party monitoring solutions in this blog post.
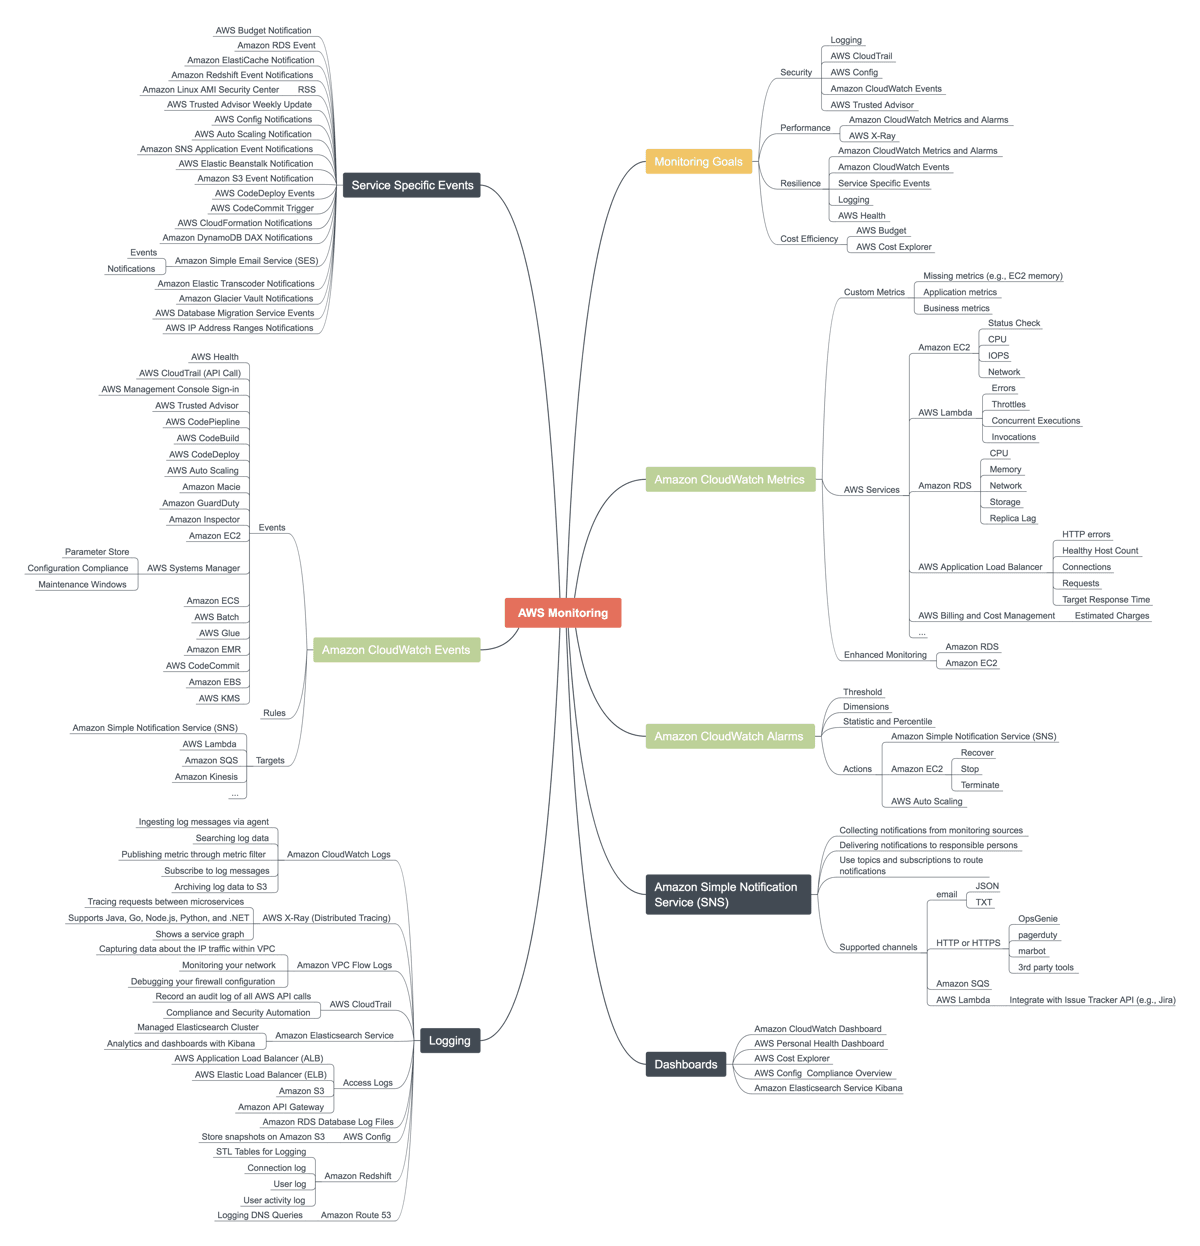
And you thought monitoring your AWS infrastructure is easy?
Amazon CloudWatch Events
Each CloudWatch event indicates an operational change in your AWS account. More and more services are publishing CloudWatch events as shown in the following excerpt of the mind map. A rule defines a filter and routes events to a target. Supported targets are Amazon SNS, AWS Lambda, Amazon SQS, and many more.
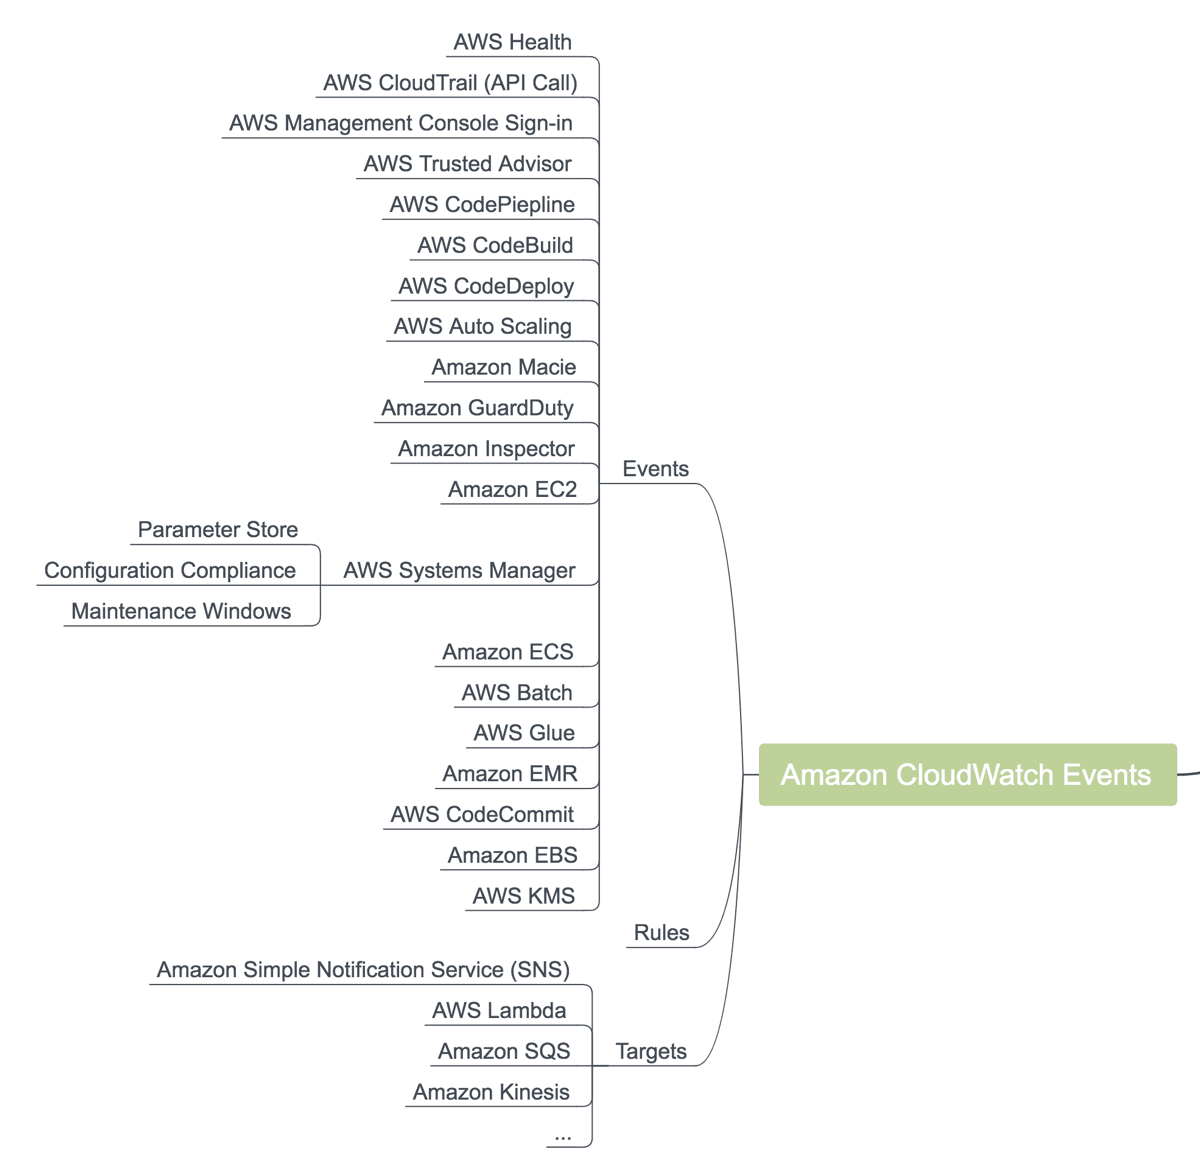
A few examples of how we use CloudWatch events for monitoring.
- When AWS needs to reboot virtual machines an AWS Health Event is published to announce the reboot in advance.
- When someone tries to log into the AWS Management Console as a root user a AWS Console Sign In via CloudTrail event is published.
- When a deployment step fails CodePipline creates an event.
Next, we will have a look at service specific events.
Service Specific Events
In addition to CloudWatch events, some services publish service specific events. Typically, service-specific events are published to Amazon SNS or sent via email. The following figure shows an overview of service-specific events.
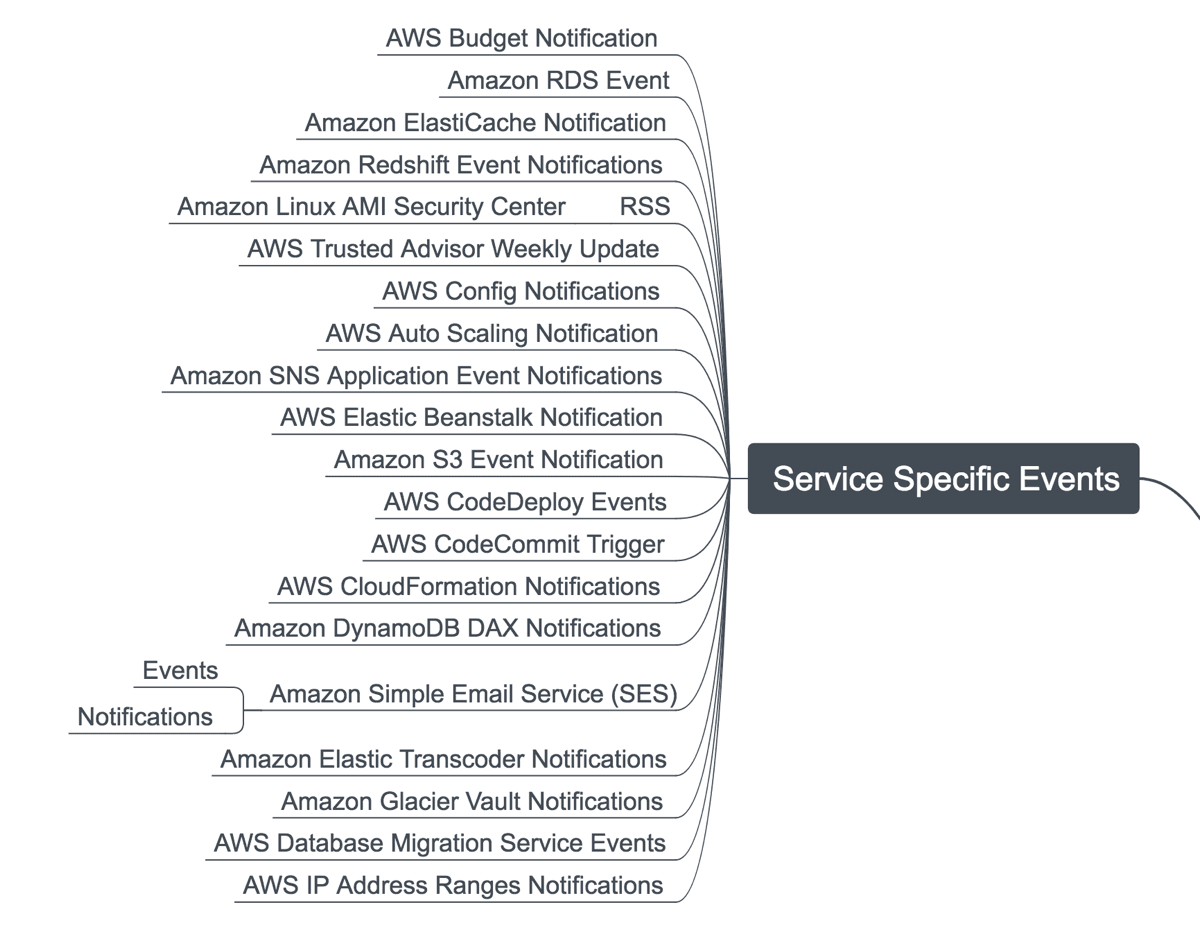
A few examples of how we use service-specific events for monitoring.
- We use AWS Budget Notifications to monitor current and forecasted costs of an AWS account.
- We subscribe to Amazon RDS events to get notified about maintenance windows or issues with our database instances.
- We configure AWS Trusted Advisor to send security, performance, cost savings and reliability advice via email.
The next step is to use CloudWatch metrics to get insights into the utilization and condition of your resources.
Amazon CloudWatch Metrics
Almost every AWS resource sends metrics to CloudWatch allowing us to look into the black boxes also known as EC2, S3, RDS, and so on.
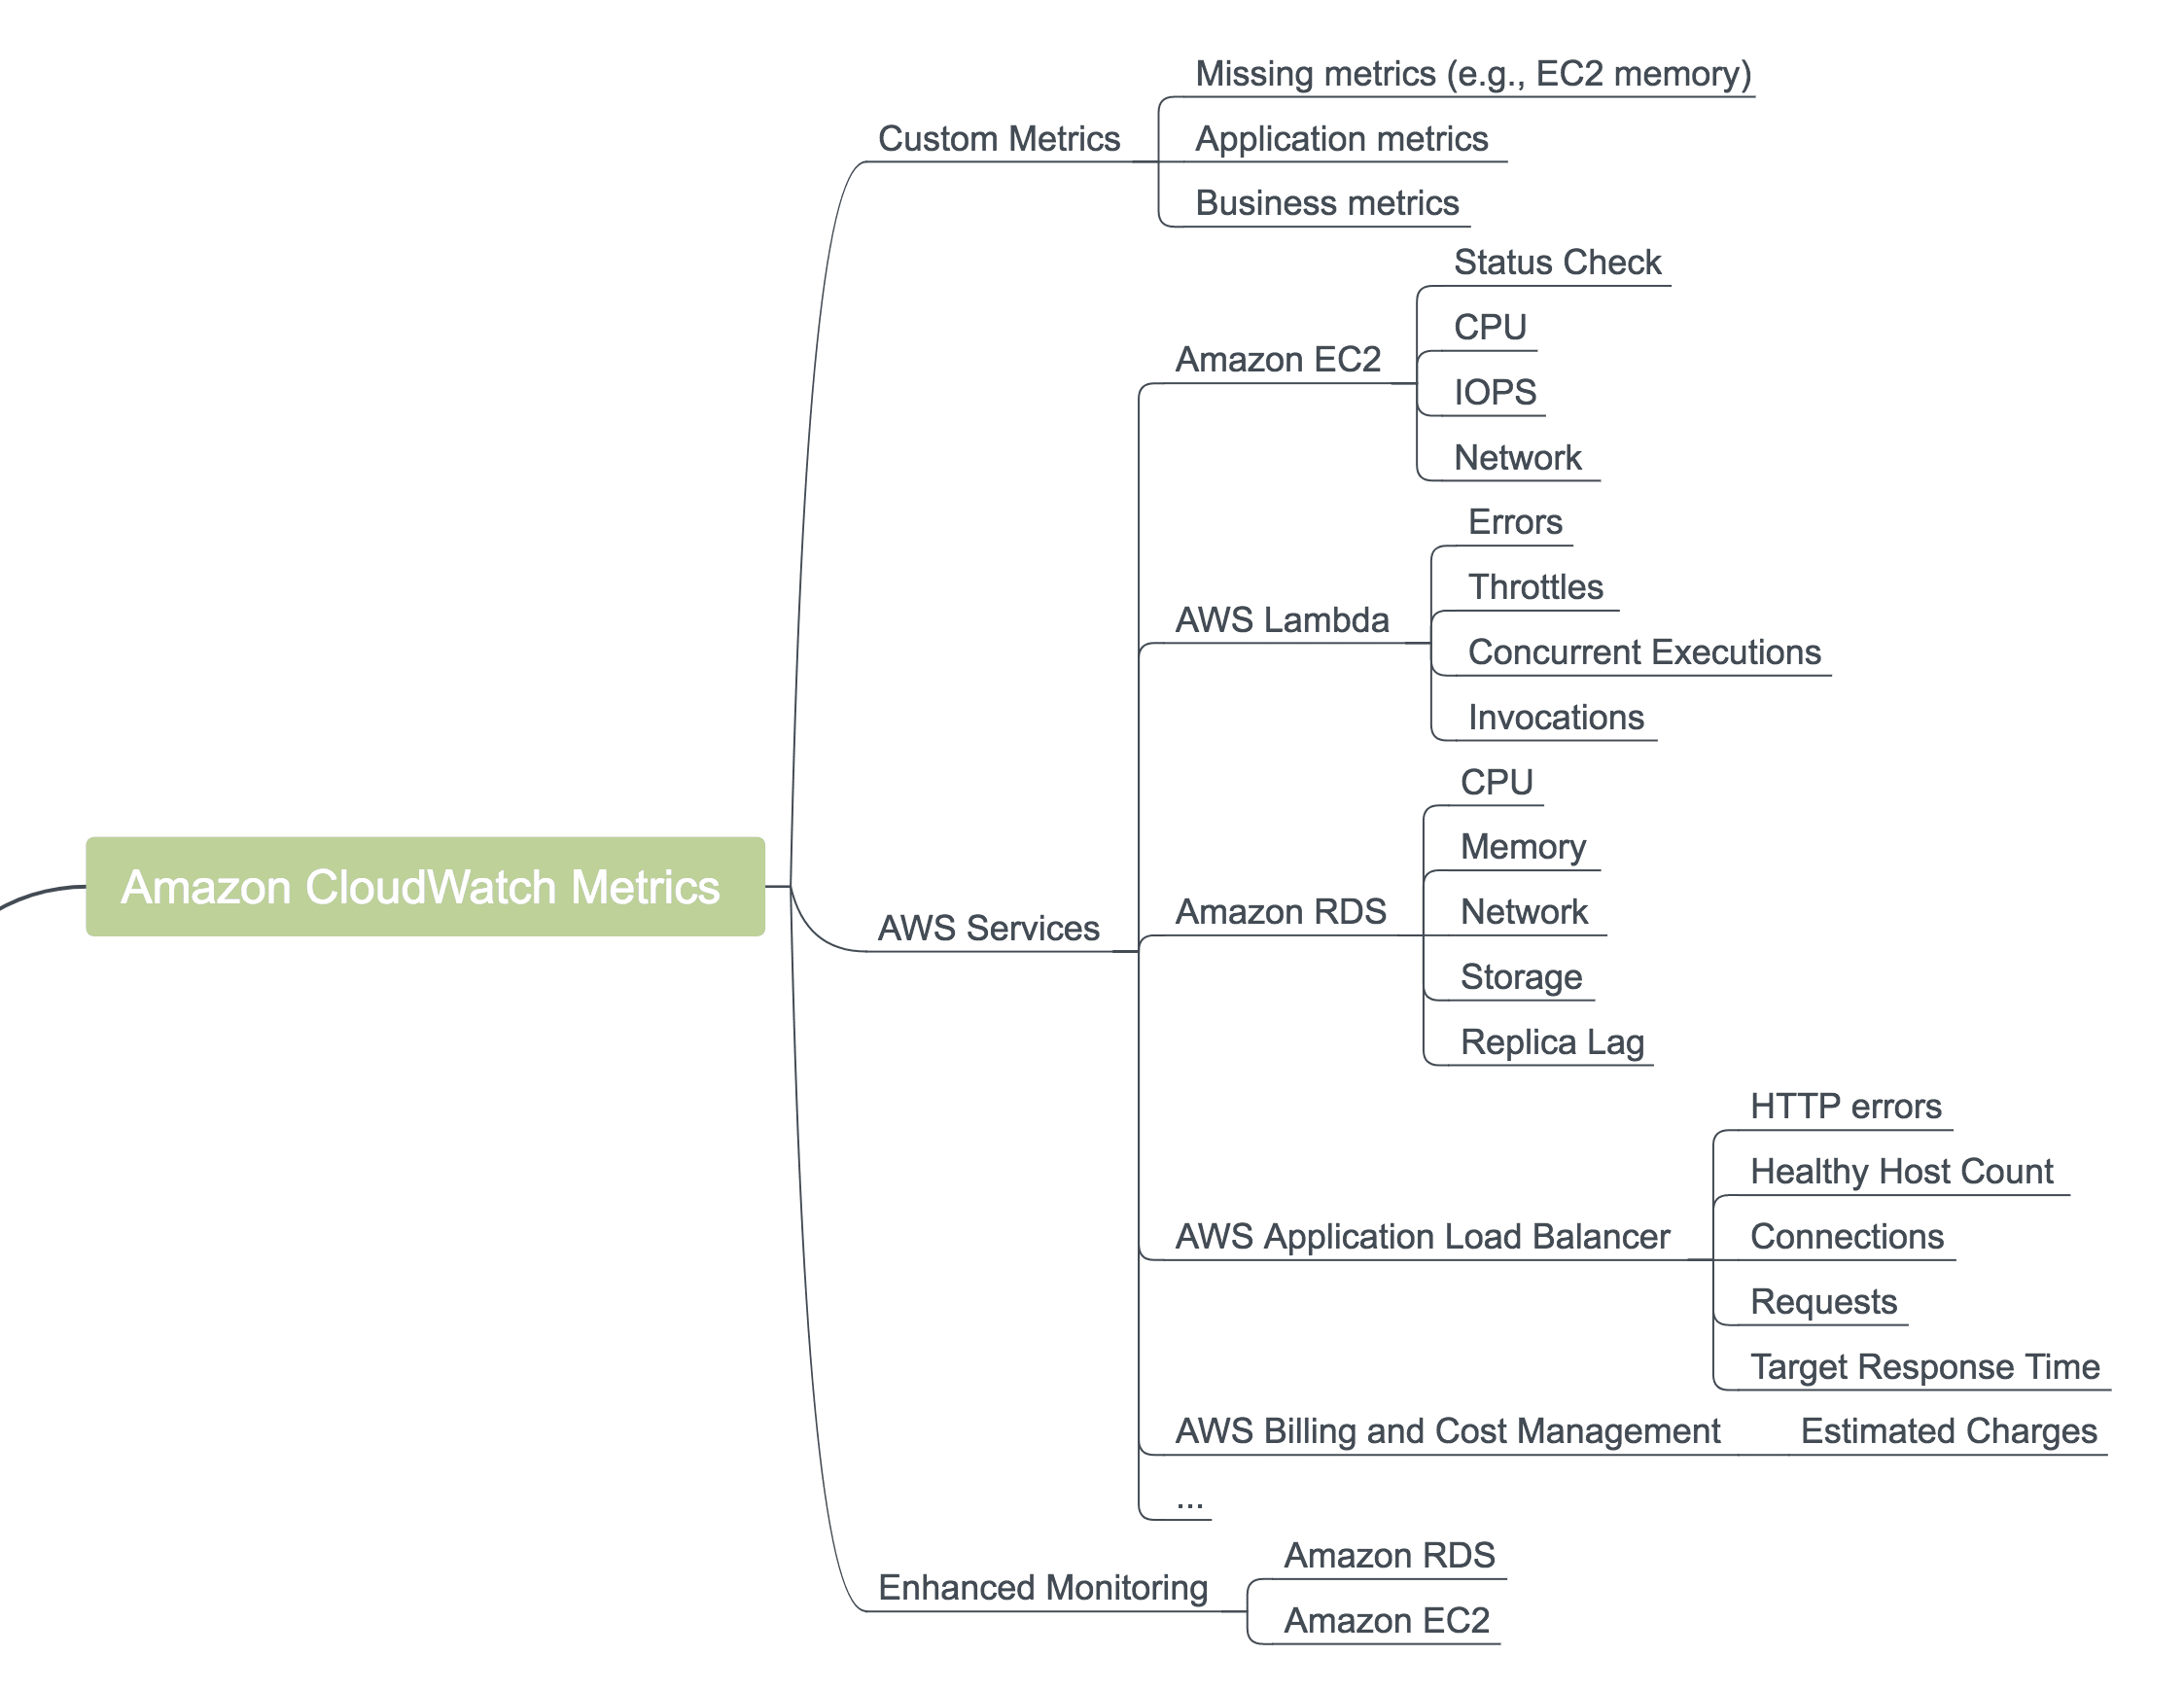
Discussing every metric available through CloudWatch is out of scope for this blog post. Have a look at Amazon CloudWatch Metrics and Dimensions Reference if you want to dive into the details.
We usually have an eye for the following metrics.
- Utilization of limited resources for EC2, RDS, and similar services: CPU, memory, storage, and network.
- Error counters like HTTP errors on ALB or failed Lambda invocations.
- Cost-related metrics like the estimated charges of the account or the consumed LCUs of an ALB.
Typically, you don’t want to look at metrics all day long. That’s why you define alarms on metrics to get notified if a metric reaches an unwanted threshold.
Amazon CloudWatch Alarms
A CloudWatch alarm defines a threshold on a CloudWatch metric. For example to get notified if the CPU utilization of an EC2 instance increases 80% on average over a period of 5 minutes. Besides sending notifications via SNS, an alarm can also trigger actions to resolve a problem automatically like recovering an EC2 instance.

We usually use CloudWatch alarms to monitor metrics indicating users of our systems do have a bad experience or our system approaches a problem which it cannot resolve itself.
- 99% of the requests processed by the load balancer are not answered within 500 ms.
- The load balancer answers request with 500 error code.
- Only 1 GB storage left on the RDS instance.
Logging
There are various sources producing log messages within your cloud infrastructure. Analyzing and monitoring all the different kinds of log messages allow you to increase security, reliability, and performance.
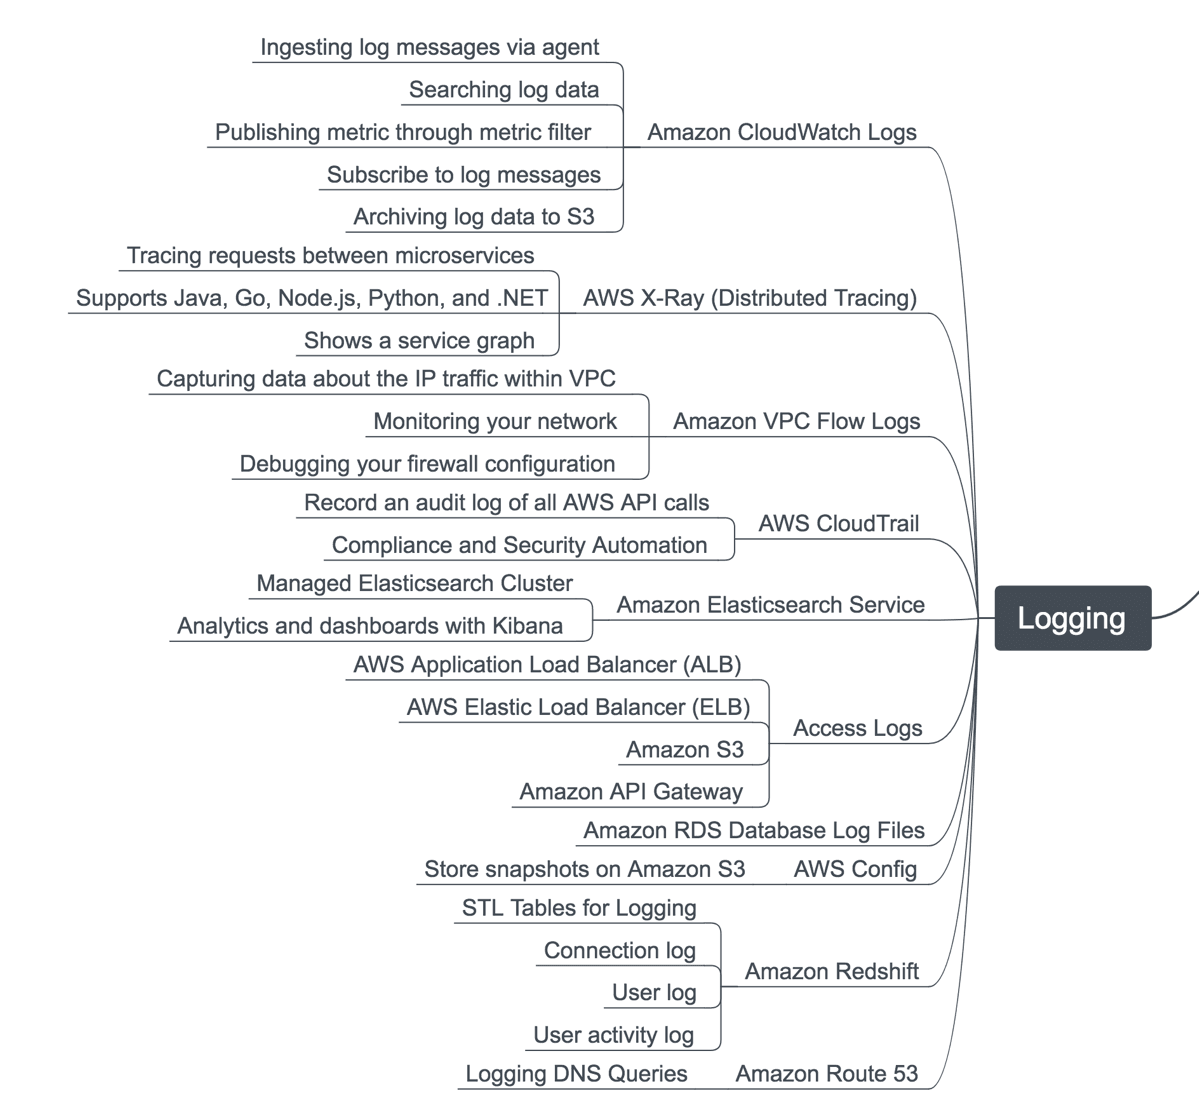
You should have a look at the following log message sources:
- Your application logs information about the processed requests or error fault conditions. Use Amazon CloudWatch Logs or Amazon Elasticsearch Service to collect log messages centralized.
- The VPC Flow Logs contain aggregated information about all packages flowing through your network. Very helpful to debug issues with your firewall configuration or to detect malicious activities.
- AWS CloudTrail provides a global audit log of your AWS account, including all AWS API requests modifying your cloud infrastructure. The go-to-source for security and compliance geeks.
Using filters allows you to watch for specific log messages and send alerts automatically. For example, notify all developers whenever the application throws an unresolvable exception.
Amazon Simple Notification Service (SNS)
Almost all discussed sources for alerts use Amazon Simple Notification Service (SNS) to deliver notifications.
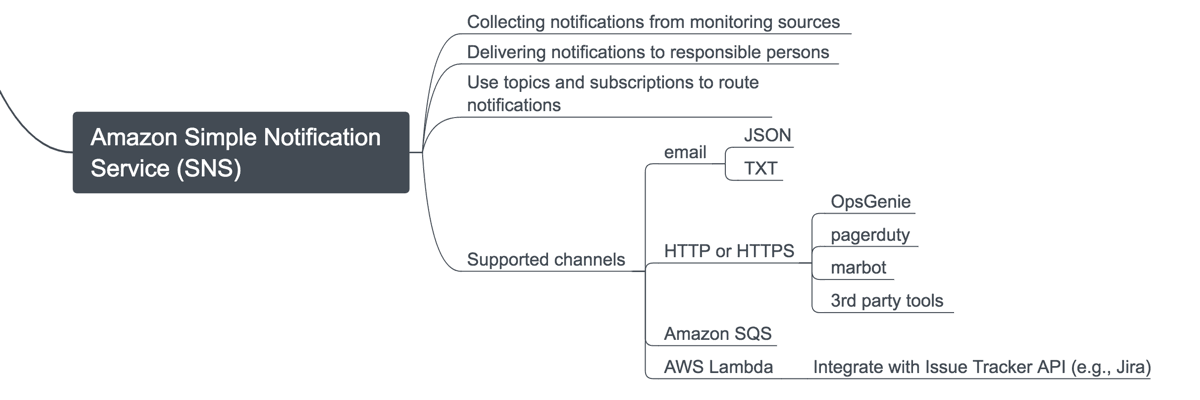
Popular options to deliver your notifications with SNS are:
- email: rough but simple way to send alerts and notifications to individuals or a whole group.
- HTTP/HTTPS: integrate with Incident Management Tools (e.g., OpsGenie, pagerduty, or marbot).
- AWS Lambda: execute a small function, e.g., to create a Jira via the Atlassian API.
Sometimes it is not necessary to send an alert and wake up a teammate. Dashboards show monitoring information casually.
Dashboards
A dashboard is a tool to provide a quick overview of the system’s status.

We use CloudWatch Dashboards to group CloudWatch metrics for different scenarios. A few examples:
- A dashboard to present all metrics indicating the state of the EC2 instances belonging to an ECS cluster.
- A dashboard showing all metrics indicating the state of a microservice.
- A dashboard displaying metrics indicating the resource consumption and occurring costs.
By the way, you should use AWS CloudFormation to define your dashboards in code instead of clicking through the AWS Management Console.
Use the AWS Personal Health Dashboard to get an overview of AWS services are suffering from any issues.
Thanks to @beratdgan, @nfonrose, @edyesed, @Cool_Sops, @moritzonken, and @derBroBro for their feedback on the mind map.
