CloudWatch Metrics & Alarms reloaded
Amazon CloudWatch improved significantly over the years. It’s time to look at its monitoring capabilities again. CloudWatch is an excellent starting point to implement enhanced monitoring on AWS. In this blog post, I demonstrate what you can do with CloudWatch metrics and alarms. Metrics provide a time-series database for telemetry (e.g., CPU utilization of an EC2 instance). Alarms watch a metric and trigger actions if a threshold is reached.

Do you prefer listening to a podcast episode over reading a blog post? Here you go!
Metrics
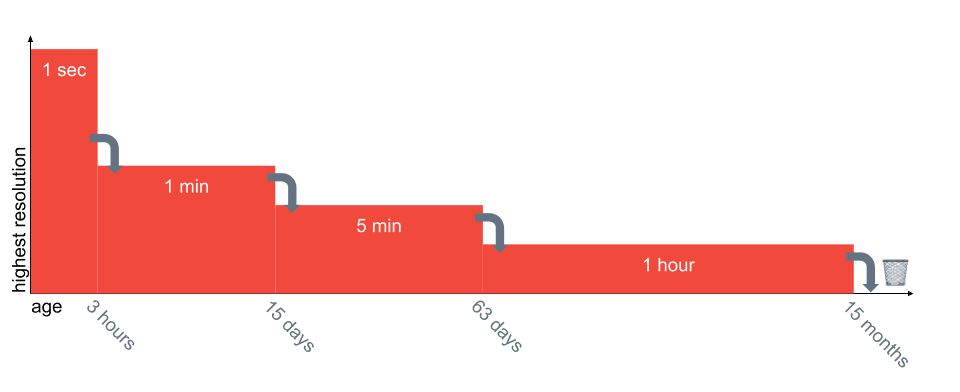
A metric stores your telemetry data for 🆕 15 months. The highest resolution is 🆕 one second. The resolution of the data is automatically reduced over time. The following figure demonstrates how the resolution is reduced over time.

Let me give you an example: If you have data points with a 1-minute resolution that become older than 15 days, CloudWatch will combine 5 data points into one as the following tables show:
| Time | Value |
|---|---|
| 08:09 | 81 |
| 08:08 | 39 |
| 08:07 | 32 |
| 08:06 | 36 |
| 08:05 | 31 |
The result is no longer a table of raw values, instead; CloudWatch stores statistics to describe the values:
| Time | Samples | Min | Max | Sum |
|---|---|---|---|---|
| 08:09 | 5 | 31 | 81 | 219 |
You can compute time window statistics (aka aggregations) over your metric data. The following functions are supported: average, minimum, maximum, sum, and 🆕 percentiles. Let me give you an example. The following data is stored in CloudWatch.
| Time | Value |
|---|---|
| 10:17 | 84 |
| 10:16 | 73 |
| 10:15 | 90 |
| 10:14 | 85 |
| 10:13 | 74 |
| 10:12 | 83 |
| 10:11 | 45 |
| 10:10 | 65 |
| 10:09 | 81 |
| 10:08 | 39 |
| 10:07 | 32 |
| 10:06 | 36 |
| 10:05 | 31 |
| 10:04 | 45 |
| 10:03 | 56 |
| 10:02 | 71 |
Let me give you an aggregation example: for all values between 10:05 (inclusive) and 10:15 (exclusive), look at 5 minute time windows (aka period), and compute the maximum.
| Time Window | Values |
|---|---|
| [10:10, 10:15[ | 65, 45, 83, 74, 85 |
| [10:05, 10:10[ | 31, 36, 32, 39, 81 |
The result will look like this:
| Time Window | Maximum |
|---|---|
| [10:10, 10:15[ | 85 |
| [10:05, 10:10[ | 81 |
🆕 Metric Math allows you to combine multiple metrics. For example, we have covered the following use cases in our blog already:
Most AWS Services (e.g., EC2, RDS, and many more) report telemetry data to CloudWatch Metrics out of the box. On top of that, you can also send your own data (aka custom metric).
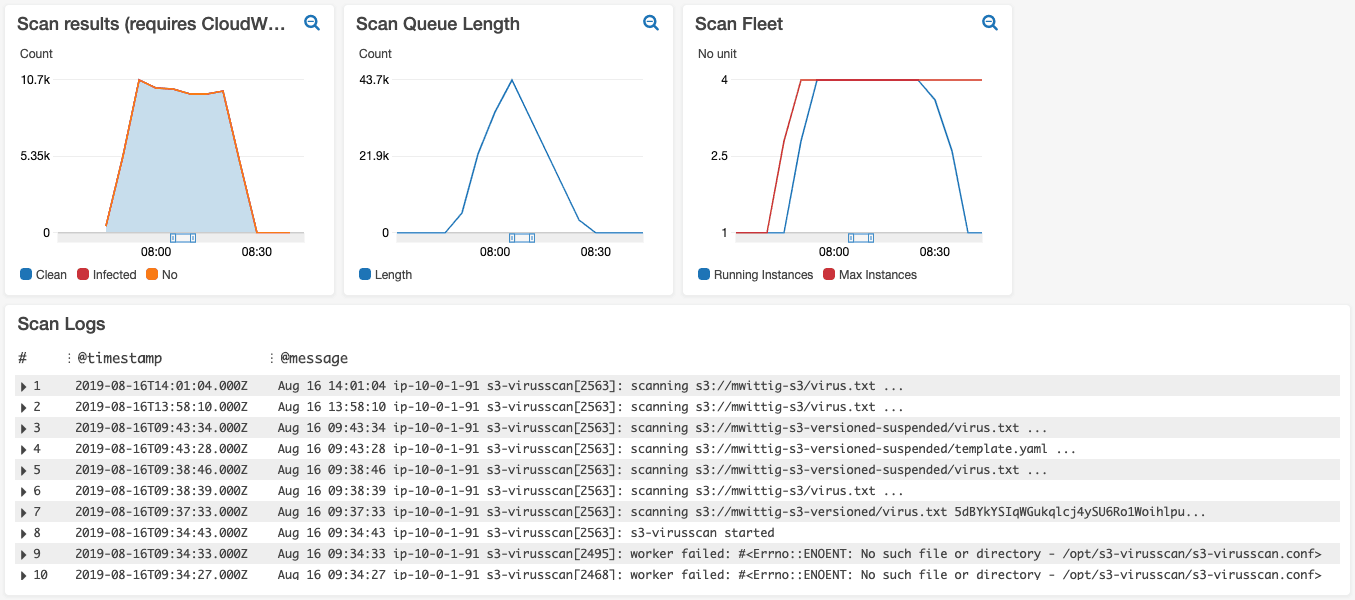
Last but not least, creating dashboards that show multiple metrics in one place is a handy feature. The following figure shows a CloudWatch dashboard of our product bucketAV - Antivirus for Amazon S3.

Alarms
A metric alarm (previously just alarm) continually runs an aggregation over the latest period(s) and checks the result against a threshold. A 🆕 composite alarm continually checks other alarms.
Composite alarms are charged twice. You pay for the metric alarms and the composite alarms. You likely don’t need composite alarms, use metric math instead!
An alarm can be in three states:
OK: Threshold is not reachedALARM: Threshold is reachedINSUFFICIENT_DATA: No data available
Whenever the state of an alarm changes, it triggers an action:
- Send a message to SNS
- Execute an EC2 auto-scaling action
- Execute an EC2 recovery action
🆕 You can configure how an alarm deals with missing data:
- ignore it altogether
- treat it as
OK - treat it as
ALARM - old behavior: go to state
INSUFFICIENT_DATA
A simple alarm could be:
If the average CPU utilization over the last 5-minutes period is greater than 80, then send a message to an SNS topic.
| placeholder | value |
|---|---|
| statistic | average |
| metric | CPU utilization |
| period | 5 minutes |
| comparator | greater than |
| threshold | 80 |
| action | send a message to an SNS topic |
Formula: If the $statistic $metric over the last $period period is $comparator $threshold, then $action.
To make alarms more stable, you can also look at the last N periods instead of only the last period:
If the average CPU utilization over the last 3 5-minutes periods is greater than 80, then send a message to an SNS topic.
| placeholder | value |
|---|---|
| statistic | average |
| metric | CPU utilization |
| period | 5 minutes |
| evaluation-periods | 3 |
| comparator | greater than |
| threshold | 80 |
| action | send a message to an SNS topic |
Formula: If the $statistic $metric over the last $evaluation-periods $period periods is $comparator $threshold, then $action.
Less prone to short spikes is the usage of 🆕 M out of N logic:
If the average CPU utilization over the last 4 5-minutes periods is greater than 80 for at least 2 times, then send a message to an SNS topic.
| placeholder | value |
|---|---|
| statistic | average |
| metric | CPU utilization |
| period | 5 minutes |
| evaluation-periods | 4 |
| datapoints-to-alarm | 2 |
| comparator | greater than |
| threshold | 80 |
| action | send a message to an SNS topic |
Formula: If the $statistic $metric over the last $evaluation-periods $period periods is $comparator $threshold for at least $datapoints-to-alarm times, then $action.
One problem with the approach so far is that you have to set the threshold. With 🆕 anomaly detection, CloudWatch will train a model to predict the threshold based on the past. Anomaly detection will recognize trends of the past 2 weeks. It is aware of hourly, daily, and weekly patterns. Keep in mind that anomaly detection only compares the present with the past two weeks. If your latency is worse every evening, that will just look fine for anomaly detection!
Summary
CloudWatch Metrics and Alarms are getting more powerful every year. Data can now be tracked at a 1-second resolution and is stored for 15 months. The new percentiles statistics is an excellent fit to monitor latencies. Metric math provides rich capabilities to work with multiple metrics at once.
The new composite alarms group multiple alarms together (easy, but more expensive than metric math). With the M out of N logic, you can ensure that your alarms can better deal with short spikes. Finally, anomaly detection can replace a static threshold.
Further reading
- Article Seamless EC2 monitoring with the Unified CloudWatch Agent
- Article Migrating to Amazon Linux 2
- Article Show your Tool: Parliament
- Tag ec2
- Tag cloudwatch
