Dead man's switch with CloudWatch
While writing this article, I’m traveling from Frankfurt to Stuttgart by high-speed train (ICE) with a top speed of 280 km/h. It is reassuring to know that a dead man’s switch stops the train immediately if the train driver becomes incapacitated, such as through death, loss of consciousness, or being bodily removed from control.

Even though you are typically using CloudWatch alarms to make sure a metric does not exceed a threshold, it is also possible to build a dead man’s switch with CloudWatch. Doing so allows you to monitor the health of processes and jobs. A few examples for typical failures to monitor with a dead man’s switch often called heartbeat monitoring as well:
- A daily backup did not complete.
- It was not possible to generate a daily report.
- An recurring import job failed.
The following example guides you through how to monitor a job backing up the home directory of an EC2 instance to S3 every 4 hours. You will learn how to create a dead man’s switch consisting of the following building blocks:
- A CloudWatch custom metric collecting heartbeats from the backup job.
- A CloudWatch alarm is monitoring the metric for missing heartbeats.
Collecting heartbeats
An EC2 instance publishes CloudWatch metrics like the CPU utilization, the number of read operations on disk, or the number of bytes sent out. Almost every other AWS service is publishing metrics as well. On top of that, you can publish a heartbeat to a custom metric as well.
The following snippet shows a backup script triggered by a cronjob every four hours.
- Synchronize the folder
/hometo S3. - Send a heartbeat to a custom metric.
|
How does publish a heartbeat to CloudWatch work?
aws cloudwatch put-metric-datasends data to a custom metric.custom/backupis the namespace used for this example.- The name of the custom metric is set to
MetricName=heartbeat. - The backup source (the
homedirectory) is used as dimension:Dimensions=[{Name=source,Value=home}]
Learn more about custom metrics. Of course, it is also possible to publish heartbeats by using one of the AWS SDKs directly from within your application.
Next, to get notified whenever the backup job does not succeed anymore you only need to create a CloudWatch alarm.
Monitoring heartbeats
A CloudWatch alarm monitors a metric and triggers actions. For example, you can use a CloudWatch alarm to notify you whenever the CPU utilization of an EC2 instance is above 80% for more than 60 minutes. However, it is also possible to implement a dead man’s switch with the help of a CloudWatch alarm as described next.
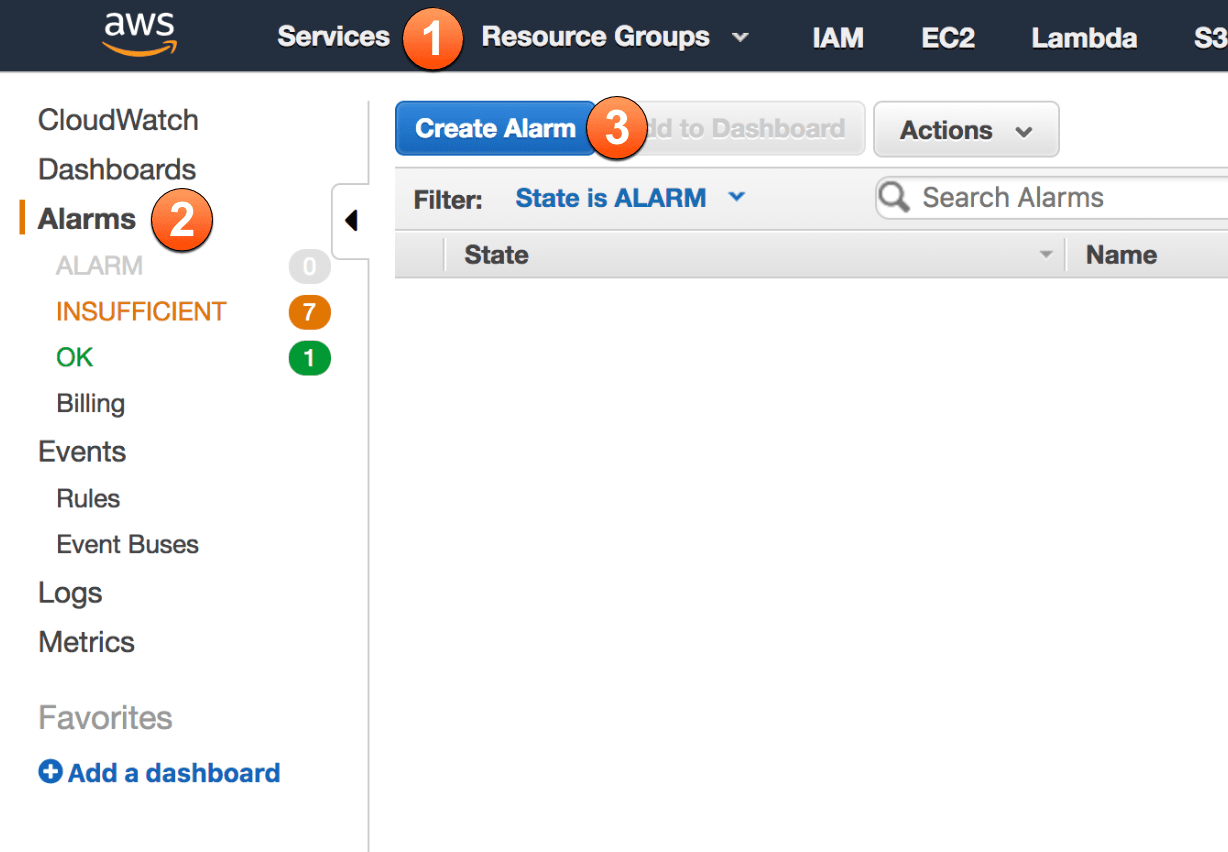
As illustrated in the following figure the following steps are necessary to start creating a new CloudWatch alarm:
- Open the CloudWatch service within the AWS Management Console.
- Select Alarms from the sub-navigation.
- Click the Create Alarm button.

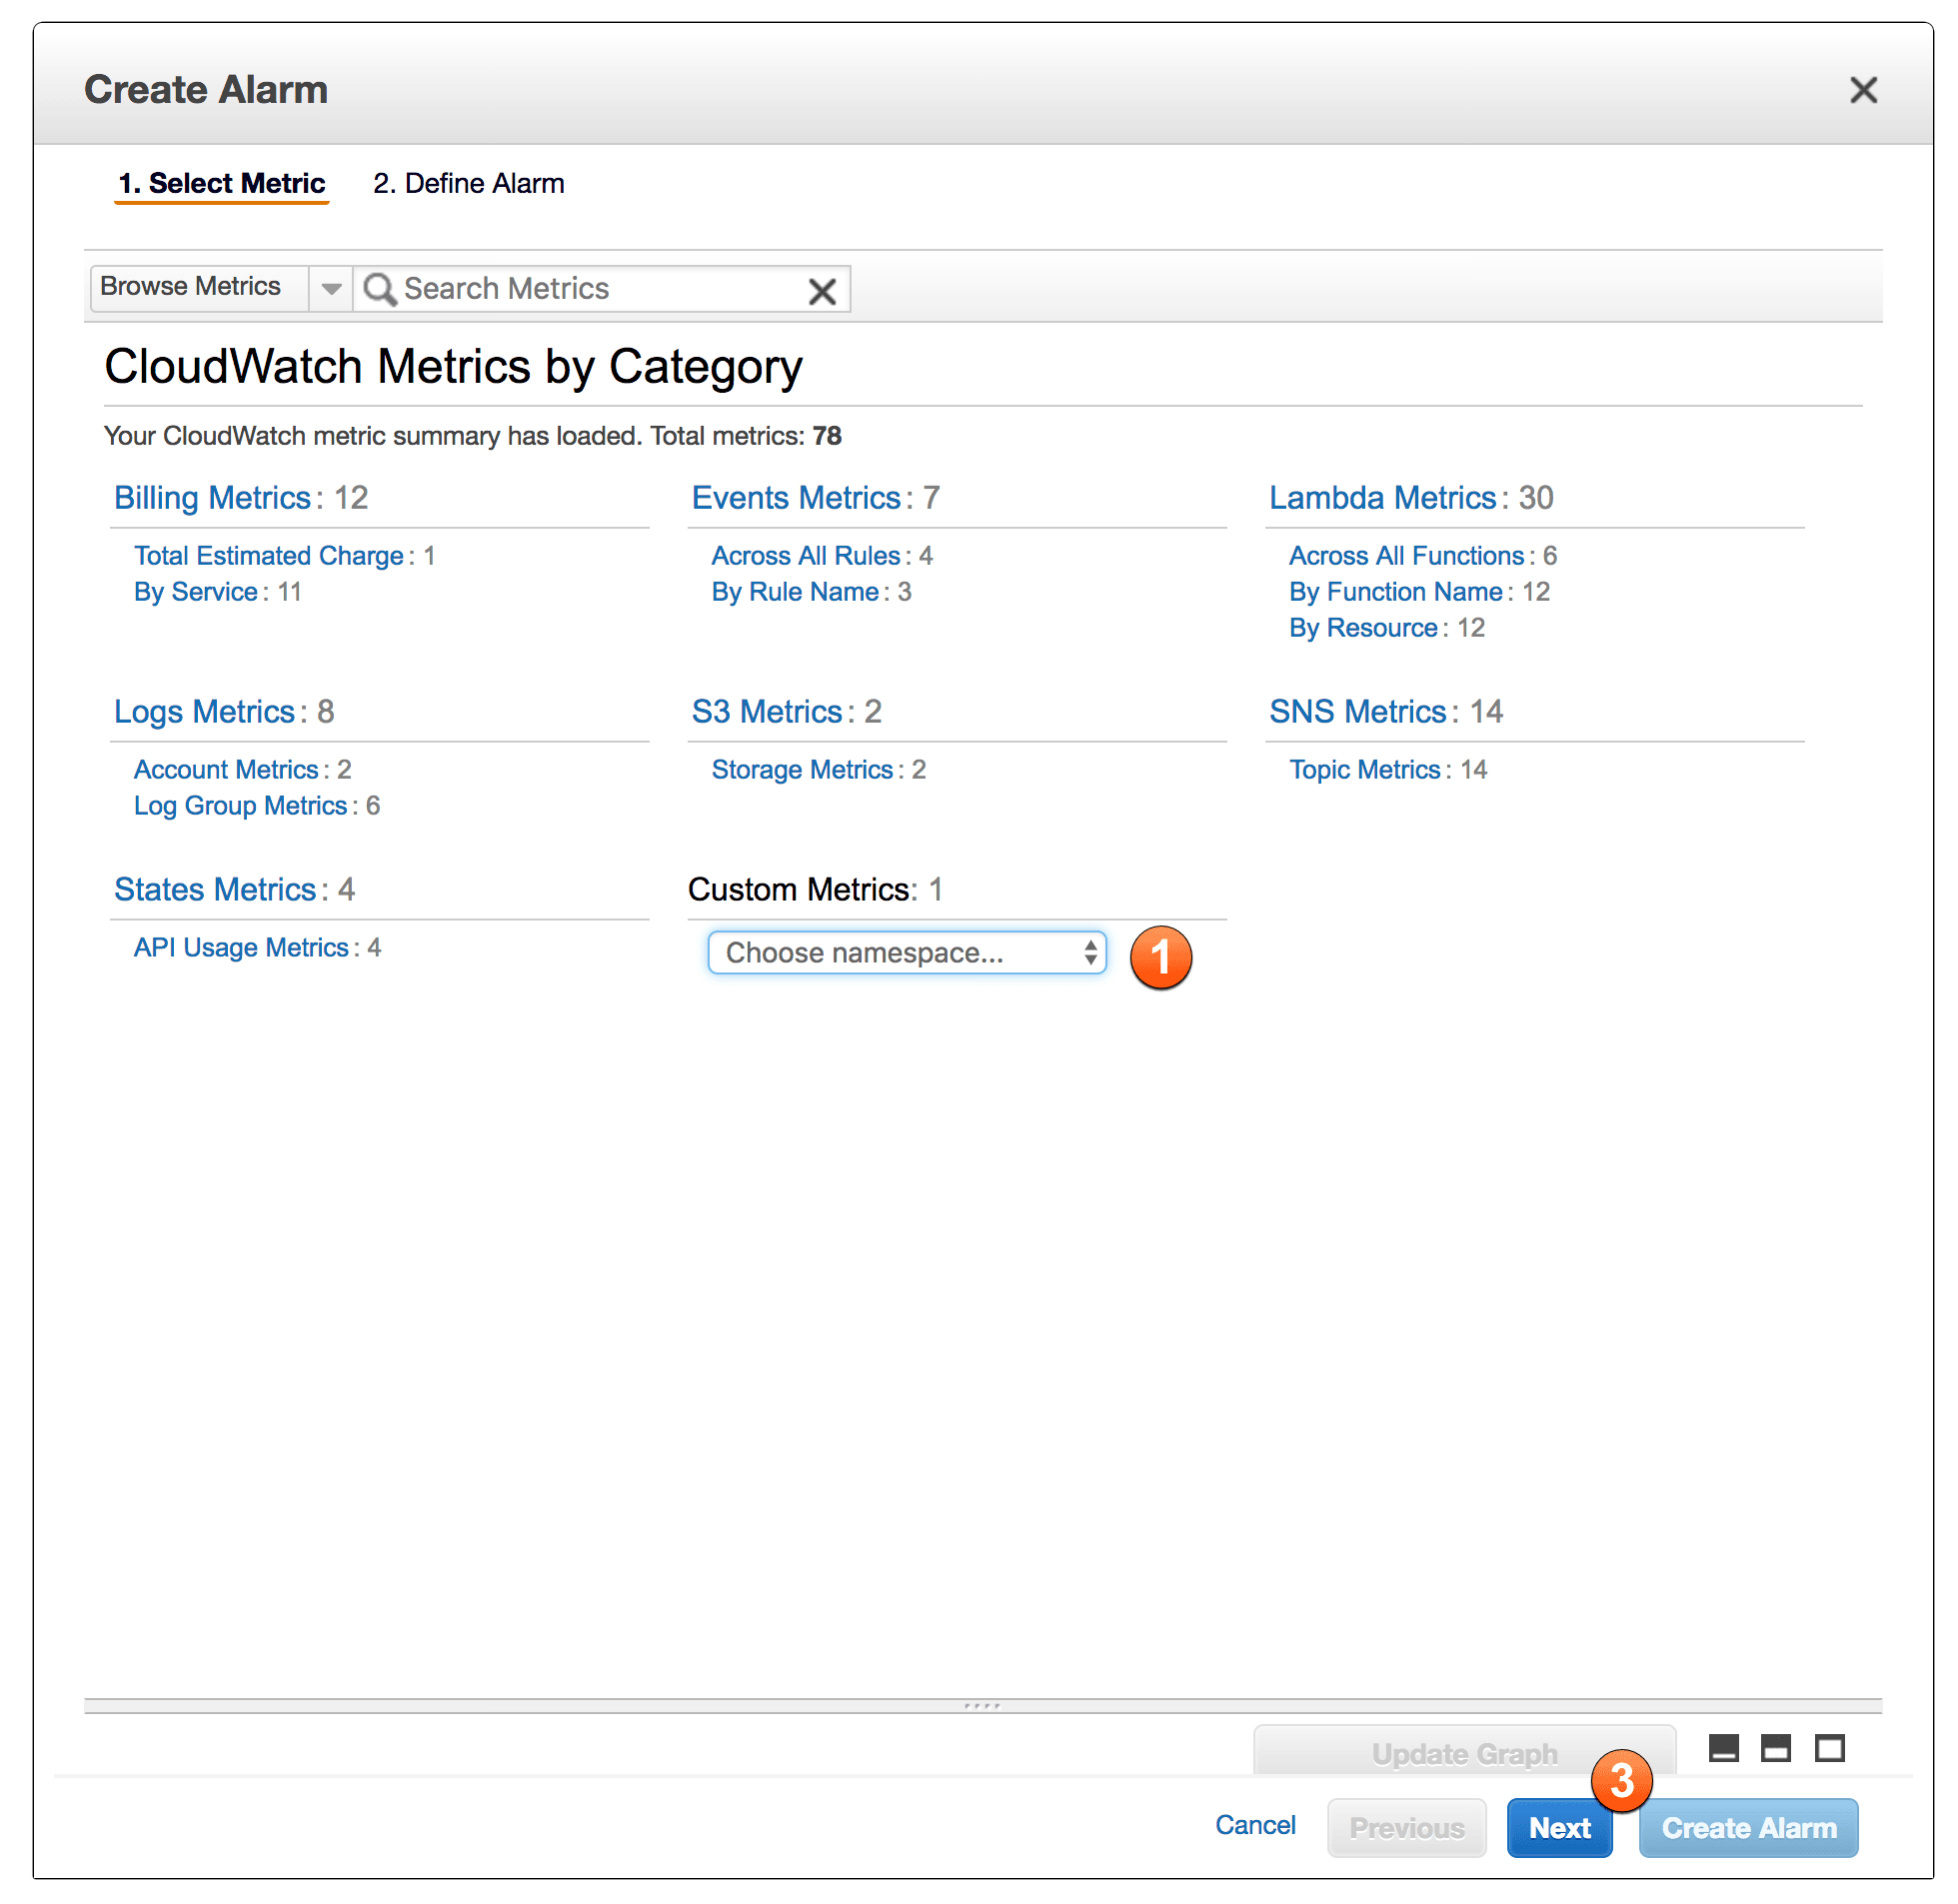
The following figure shows how to select the custom metric.
- Choose the namespace
custom/backup. - Select the metric with the metric name
heartbeatand sourcehome. - Click the
Nextbutton.

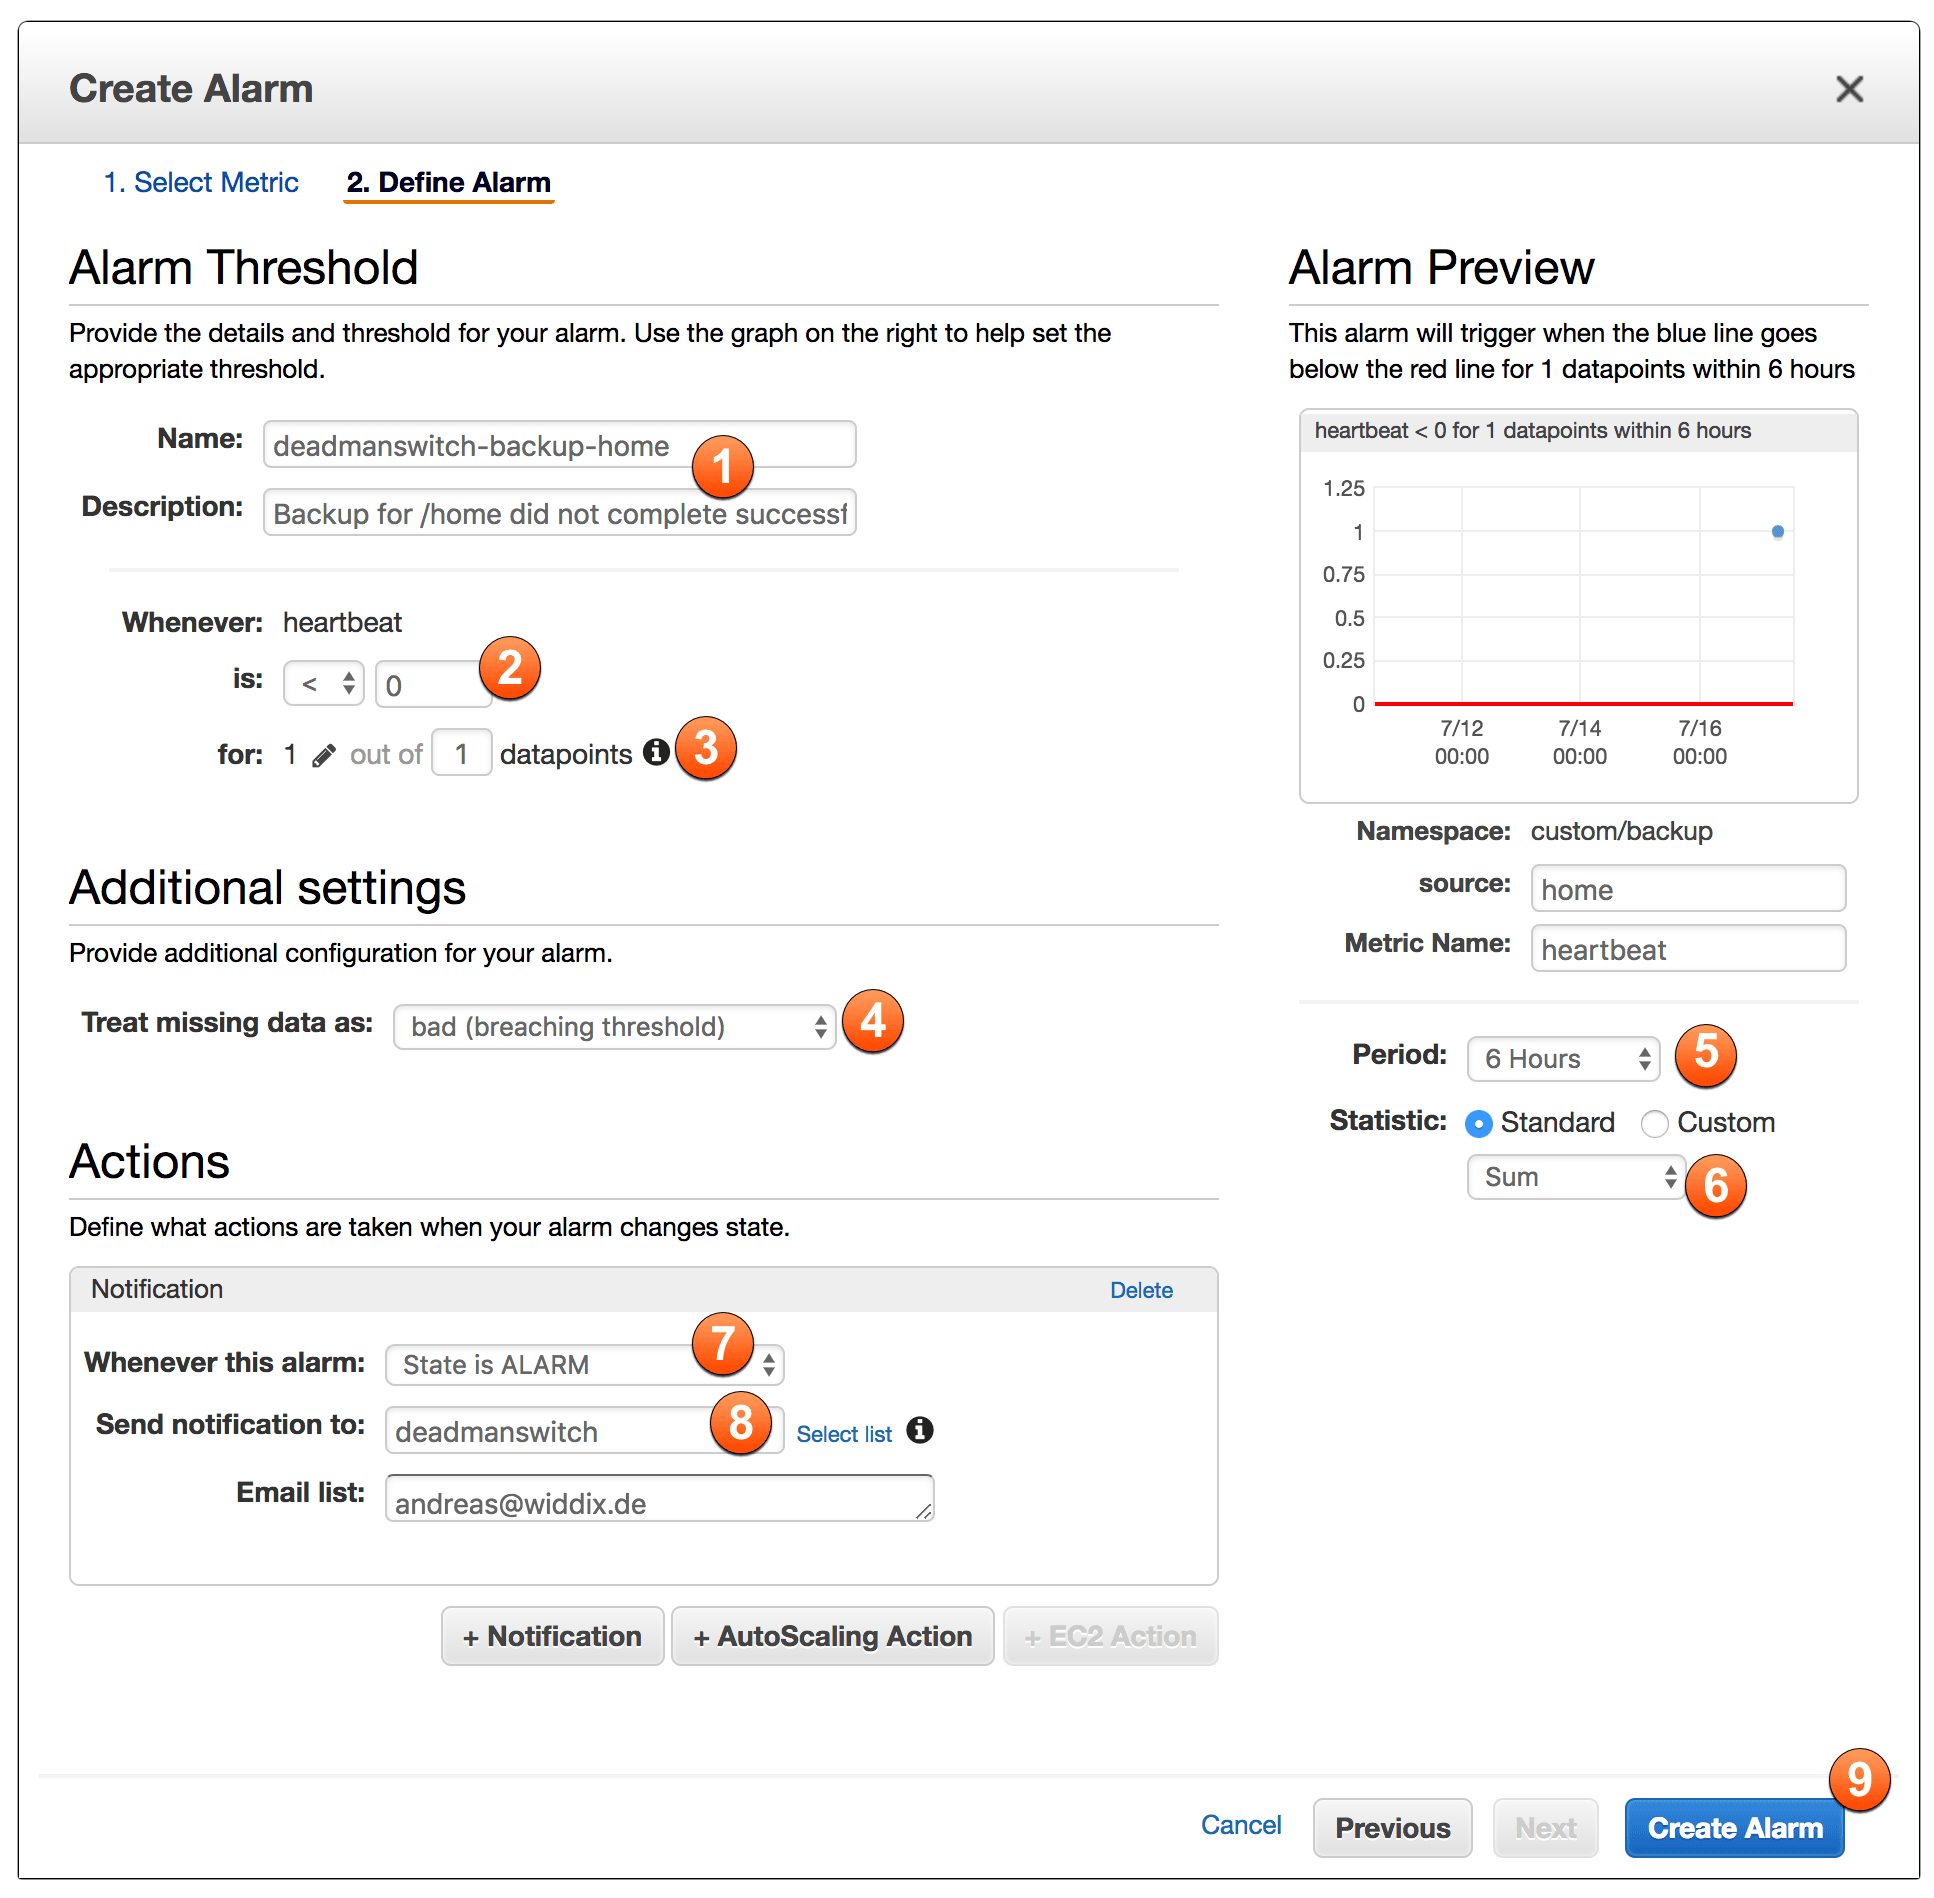
The last step is to configure the alarm as illustrated in the following figure.
- Type in
deadmanswitch-backup-homeas the Name and a Description for the alarm. - Select
< 0as the threshold for the alarm … - … for
1 out of 1data points. - Most importantly, set treat missing data as to
bad. - Select a timeframe of 6 hours.
- Select the statistic method
Sum. - Define an
ALARMaction. - Create a new list and enter your email address.
- Don’t forget to press the Create Alarm button.

By default, a CloudWatch alarm is entering the state INSUFFICIENT_DATA when there are no data points within the specified timeframe, which is 6 hours in our example. As we are configuring the alarm to treat missing data as bad, the alarm will enter the state ALARM instead of INSUFFICIENT_DATA. Learn more about how alarms treat missing data.
Summary
Creating a dead man’s switch with the help of CloudWatch allows you to monitor if jobs are working as expected. I’ve used this approach to monitor an agent responsible for synchronizing data from an on-premises database to DynamoDB, for example.
Thanks a lot, Josh. Your feedback improved the bash script and dead man’s switch.
