How to monitor container workloads running on ECS and Fargate?
How do you monitor a container workload running on ECS (Elastic Container Service) and Fargate with on-board resources? Here are the prioritized aspects when it comes to monitoring containers on AWS.
- Event-driven monitoring with EventBridge
- Monitoring entry points like ALB, SQS, and Kinesis
- Monitoring inter-service communication (Service Connect)
- Observing container utilization
- Collecting and analyzing container logs

Event-driven monitoring with EventBridge
Most importantly, ensure that you are not missing ECS failure events. Like many AWS services, ECS sends events to EventBridge. Monitoring those events by creating EventBridge rules is crucial to get informed about container-related issues.
For example, the following pattern filters events indicating that an ECS task stopped because one of the essential containers exited with an error.
{ |
Besides that, an EventBridge rule with the following pattern will watch for failed ECS deployments.
{ |
On top of that, use EventBridge rules to monitor tasks that are failing when starting, failed ECS service actions, or ECS tasks stopping due to Fargate Spot interruption.
marbot - our AWS monitoring solution - deploys the necessary EventBridge rules to all your AWS accounts automatically and delivers alerts or notifications to Slack or Microsoft Teams.
Monitoring entry points like ALB, SQS, and Kinesis
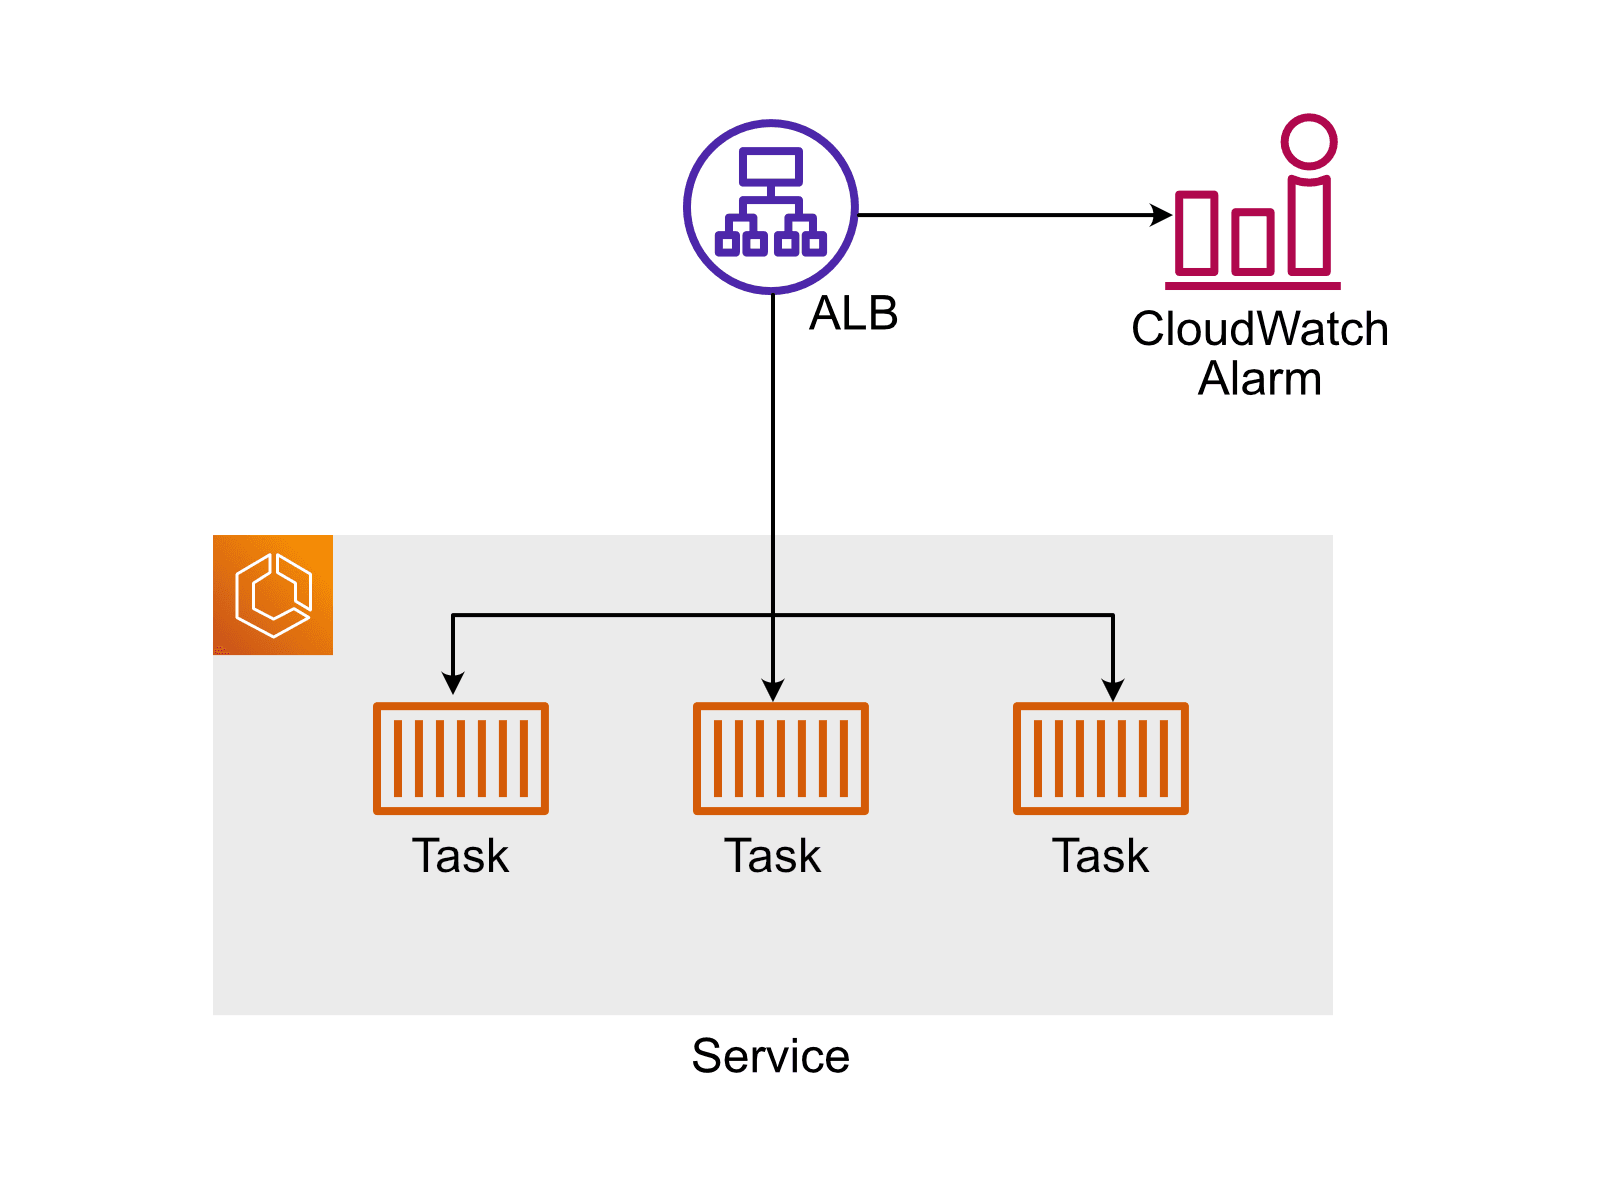
Monitoring ECS events in real-time is a good start. But monitoring entry points like the ALB (Application Load Balancer) or SQS (Simple Queue Service) is essential.

To do so, create CloudWatch alarms monitoring the following metrics.
- ALB
HTTPCode_ELB_5XX_Countto monitor 5XX errors sent from ALB to the client.TargetResponseTimeto monitor the response latency.
- SQS
ApproximateAgeOfOldestMessageto monitor for messages that are not getting processed.ApproximateNumberOfMessagesVisibleto monitor for messages piling up in the queue.
- Kinesis Data Stream
GetRecords.IteratorAgeMillisecondsto monitor for shards not getting processed.
Monitoring those metrics ensures that you get notified as soon as users experience issues but do not create too many notifications, causing alert fatigue.
Monitoring inter-service communication (Service Connect)
ECS has three different inter-service communication options: Service Discovery, Service Connect, and App Mesh.
With service discovery, there is no built-in mechanism for monitoring. Service Connect provides CloudWatch metrics. App Mesh uses Envoy under the hood, which provides metrics but does not integrate with CloudWatch by default.
If Service Connect is used for inter-service communication within an ECS cluster, monitor the following CloudWatch metrics.
HTTPCode_Target_5XX_CountThe number of responses with 5XX error code.TargetResponseTimeThe time elapsed (milliseconds) after the request reached the Service Connect proxy in the target task until the proxy receives a response from the target container.
Observing container utilization
By default, ECS provides the following utilization metrics for an ECS service.
CPUUtilizationThe CPU utilization among all tasks belonging to the service.MemoryUtilizationThe memory utilization among all tasks belonging to the service.
ECS records additional metrics after enabling Container Insights for a cluster. Among them are the following utilization metrics.
EphemeralStorageReservedandEphemeralStorageUtilizedto get insights into the storage utilization (only available for Fargate tasks/containers).StorageReadBytesandStorageWriteBytesto get insights into the storage throughput.NetworkRxBytesandNetworkTxBytesto get insights into the networking throughput.
Collecting and analyzing container logs
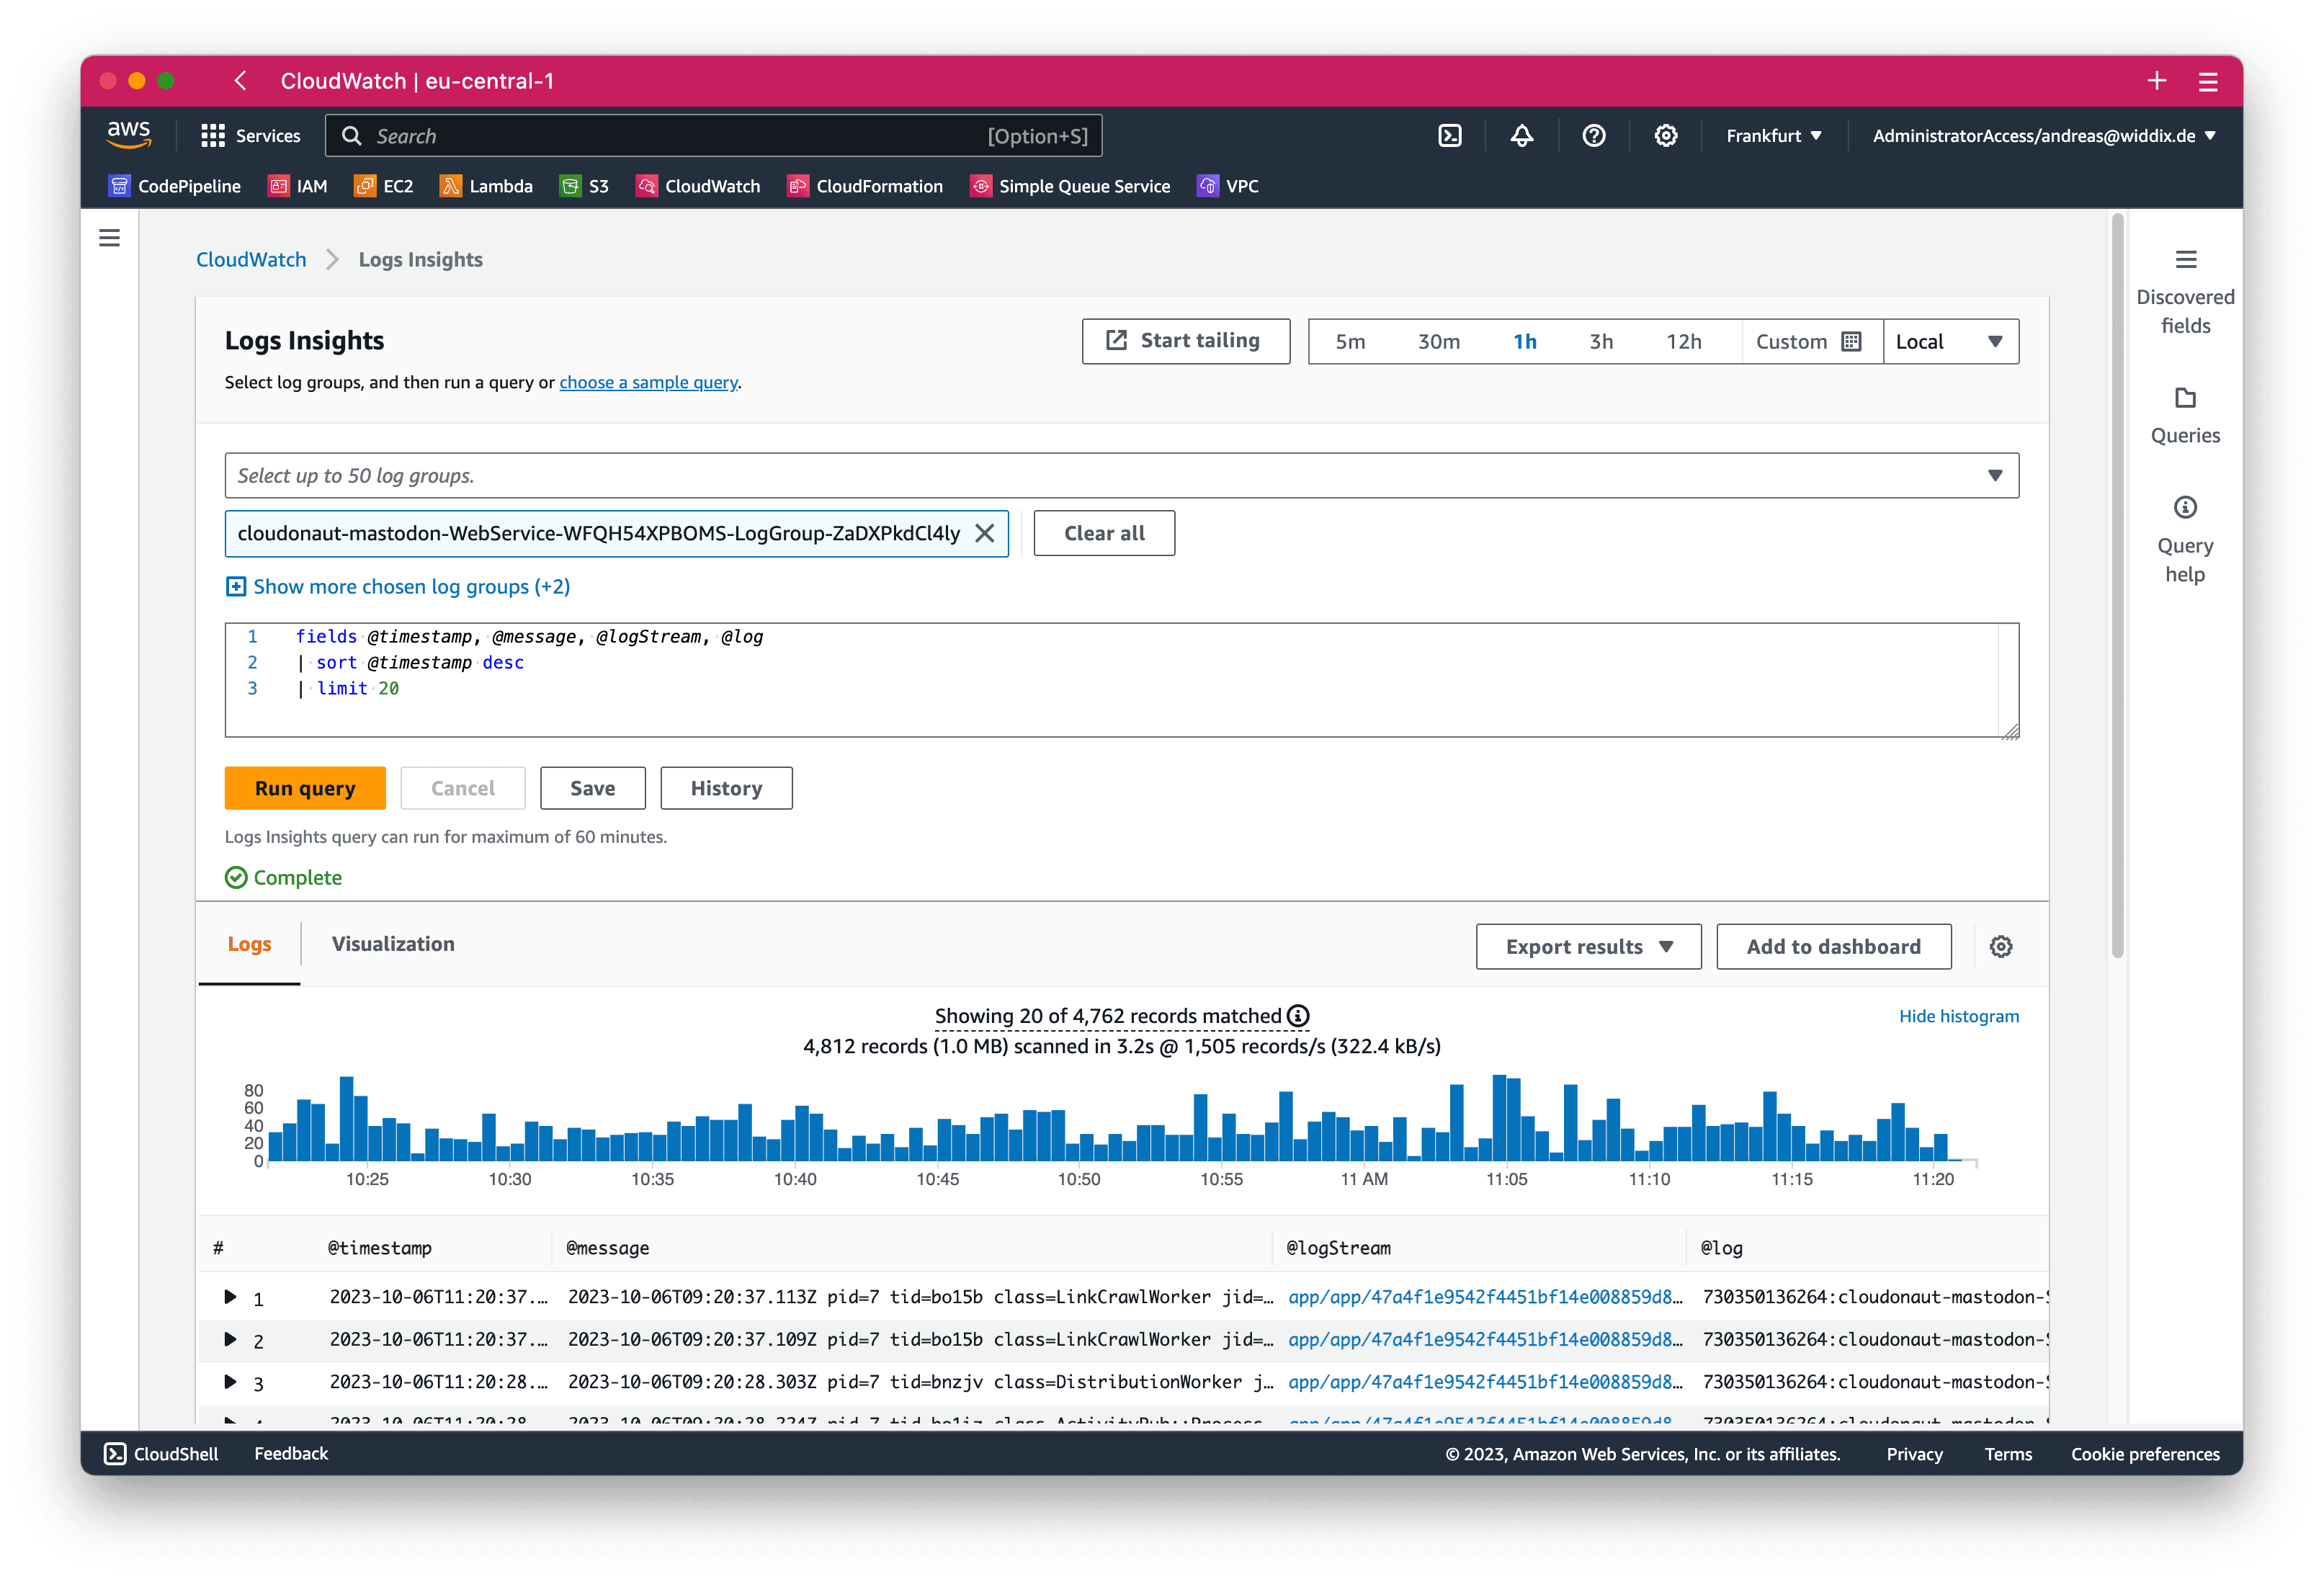
By default, ECS ships log messages to CloudWatch Logs. Compared to other solutions, CloudWatch Logs comes with zero operations and maintenance effort. With CloudWatch Logs Insights, the capabilities to analyze log messages for debugging come close to other solutions like the Elastic stack.

Summary
To avoid blind spots when monitoring container workloads running on ECS and Fargate, consider the following aspects:
- Event-driven monitoring with EventBridge
- Monitoring entry points like ALB, SQS, and Kinesis
- Monitoring inter-service communication (Service Connect)
- Observing container utilization
- Collecting and analyzing container logs
