Monitoring a critical part of your infrastructure: Amazon Relational Database Service (RDS)
Amazon RDS provides PostgreSQL, MySQL, MariaDB, Oracle, and Microsoft SQL Server as a Service. The fully managed service covers a lot of the challenges of operating a database (e.g., master-standby replication, snapshots, patching the operating system and the database system, …). But you are still responsible for some operational aspects: sizing and performance optimizations. Therefore, you need to monitor every RDS instance that serves production workloads.
Aurora is not covered in this post.
Monitoring your whole cloud infrastructure is a complex task, as Andreas pointed out in his AWS Monitoring Primer. In this blog post, I will focus on the relevant parts for monitoring your RDS database instances:
- I guide you to the relevant AWS monitoring services and features offered by AWS.
- I present best practices based on real-world client projects.
- I provide a CloudFormation template that implements all ideas in the post.
- You can use the template to monitor any RDS database instance in a minute.
Let’s get started!
Identifying important CloudWatch metrics
Each RDS database instance (Multi-AZ or Single-AZ) sends metrics to CloudWatch.

The most important metrics are:
| area | metric | description | relevance |
|---|---|---|---|
| Storage | BurstBalance | The percent of burst credits available. (only applies to the storage type gp2) | If you run out of burst credits, I/O performance will drop significantly. |
| Storage | DiskQueueDepth | The number of outstanding IOs (read/write requests) waiting to access the disk. | If many requests are queued, the storage is a bottleneck and latency is increased. |
| Storage | FreeStorageSpace | The amount of available storage space in bytes. | If your DB instance runs out of storage space, it might no longer be available. |
| CPU | CPUUtilization | The percentage of CPU utilization. | If the CPU is highly utilized, latency is added because computing tasks have to wait until they are scheduled. |
| CPU | CPUCreditBalance | The number (not percentage!) of burst credits available. (only applies to the instance family t2) | If you run out of burst credits, performance will drop significantly. |
| Memory | FreeableMemory | The amount of available random access memory in bytes. | A highly utilized system usually comes with higher latency. |
| Memory | SwapUsage | The amount of swap space used on the DB instance in bytes. | If memory is moved to disk performance usually suffers. |
Once important metrics are identified, you can use them to understand how a healthy system differs from an impacted system.
Defining thresholds
One of the hardest parts of monitoring is to define what healthy means. For each metric, you have to define a threshold between healthy and impacted. E.g., you regard CPU utilization under 80% as healthy because the application was never impacted when the CPU was not utilized. Thresholds are defined based on observations from the past. They might need adjustment in the future.
We don’t know about the whole application here. We can only reason about one component: the database. Application monitoring is a different topic. E.g., HTTP 5XX responses, latency, sign-ups.
From our experience, we usually start with the following thresholds to identify unhealthy behavior and adjust them over time.
| area | metric | comparison operator | threshold | rationale |
|---|---|---|---|---|
| Storage | BurstBalance | < | 20 % | 20 % of credits allow you to burst for a few minutes which gives you enough time to a) fix the inefficiency, b) add capacity or c) switch to io1 storage type. |
| Storage | DiskQueueDepth | > | 64 | This number is calculated from our experience with RDS workloads. |
| Storage | FreeStorageSpace | < | 2 GB | 2 GB usually provides enough time to a) fix why so much space is consumed or b) add capacity. You can also modify this value to 10% of your database capacity. |
| CPU | CPUUtilization | > | 80 % | Queuing theory tells us the latency increases exponentially with utilization. In practice, we see higher latency when utilization exceeds 80% and unacceptable high latency with utilization above 90% |
| CPU | CPUCreditBalance | < | 20 | One credit equals 1 minute of 100% usage of a vCPU. 20 credits should give you enough time to a) fix the inefficiency, b) add capacity or c) don't use t2 type. |
| Memory | FreeableMemory | < | 64 MB | This number is calculated from our experience with RDS workloads. |
| Memory | SwapUsage | > | 256 MB | Sometimes you can not entirely avoid swapping. But once the database accesses paged memory, it will slow down. |
Now you know what healthy/unhealthy means. It’s time to define CloudWatch Alarms to send you an alert if a metric exceeds its threshold.
Observing metrics with CloudWatch Alarms and marbot
A CloudWatch Alarm continuously watches a metric. Once the threshold is reached, an action is performed that sends a message to an SNS topic. From this topic, you can then send yourself an email. We found that emails are not a good way to handle alerts. In a team, multiple people are responsible. If you send an email to a group email address:
- Your team has no idea if someone already started to work on solving the issue.
- You disturb the whole team for each alert.
- It’s easy to ignore an email.
- You have no statistics about how many alerts are generated. Too many alerts are an indication that your team is no longer able to handle them.
- No help to investigate the issue is available, like links to the AWS Management Console.
To solve the problem, we built marbot: a Slack chatbot that manages and escalates AWS alerts for you.

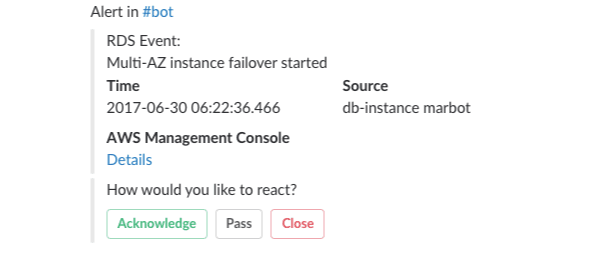
marbot sends alerts to a single user from the Slack channel via a direct message. If the user doesn’t acknowledge the alert within 5 minutes, marbot will escalate to the next level. Escalations minimize distraction while keeping response time low. Try marbot for free now.
A sample alert follows:

Other sources
Besides metrics, RDS sends out events if the state of the database instance has changed. E.g., because of a Multi-AZ failover.

We recommend to subscribe to events of the following categories:
- failover
- failure
- low storage
- maintenance
- notification
- recovery
CloudFormation template
We developed a CloudFormation template to monitor an RDS database instance in any region. The template integrates with marbot, but you can modify it to send out emails. The template is available on GitHub for free.
If you have already installed marbot, you can also ask marbot to monitor your RDS database or read more detailed setup instructions. Otherwise: Try marbot for free now.
Summary
There are multiple options available to monitor an RDS database instance. Most importantly, CloudWatch Metrics and Alarms. But you should also not forget about RDS events. Otherwise, you miss events like failovers.
CloudWatch Alarms can trigger actions. The obvious choice is to send out an email if a metric exceeds a threshold. But we recommend not to use emails. Instead, use a tool like marbot. marbot comes with alert escalation, deduplication, and context-aware links to the AWS Management Console.
Further reading
- Article AWS Monitoring Primer
- Article Monitoring a critical part of your infrastructure: Amazon ElastiCache memcached cluster
- Article Monitoring a critical part of your infrastructure: Amazon Elasticsearch domain
- Article Send CloudWatch Alarms to Slack with AWS Lambda
- Article CloudWatch is neglected: Why is the control room empty?
- Tag rds
- Tag cloudwatch
