Analyze CloudWatch Logs like a pro
This post was originally published on the marbot blog.
Centralizing the logs from all your systems is critical in a cloud infrastructure. Typical solutions to store and analyze log messages are: Elastic Stack (Elasticsearch + Kibana), Loggly, Splunk, and Sumo Logic.

I prefer Amazon CloudWatch Logs in most cases. Why? Because CloudWatch Logs is a fully-managed service and scales horizontally. Also, CloudWatch Logs is billed by used storage and data ingestion, which means there are no idle costs.
The analytics functionality of CloudWatch Logs was minimal compared to the competitors. However, AWS released a new feature in November 2018: CloudWatch Logs Insights. You will learn how to analyze your log messages with CloudWatch Logs Insights like a pro in the following.
What is CloudWatch Logs Insights?
CloudWatch Logs Insights is an extension of CloudWatch Logs.
The key benefits of CloudWatch Logs Insights are:
- Fast execution
- Insightful visualization
- Powerful syntax
Analyzing log messages with CloudWatch Logs Insights costs $0.005 per GB of data scanned (see CloudWatch pricing for costs in other regions than U.S. East N. Virginia).
How to query logs?
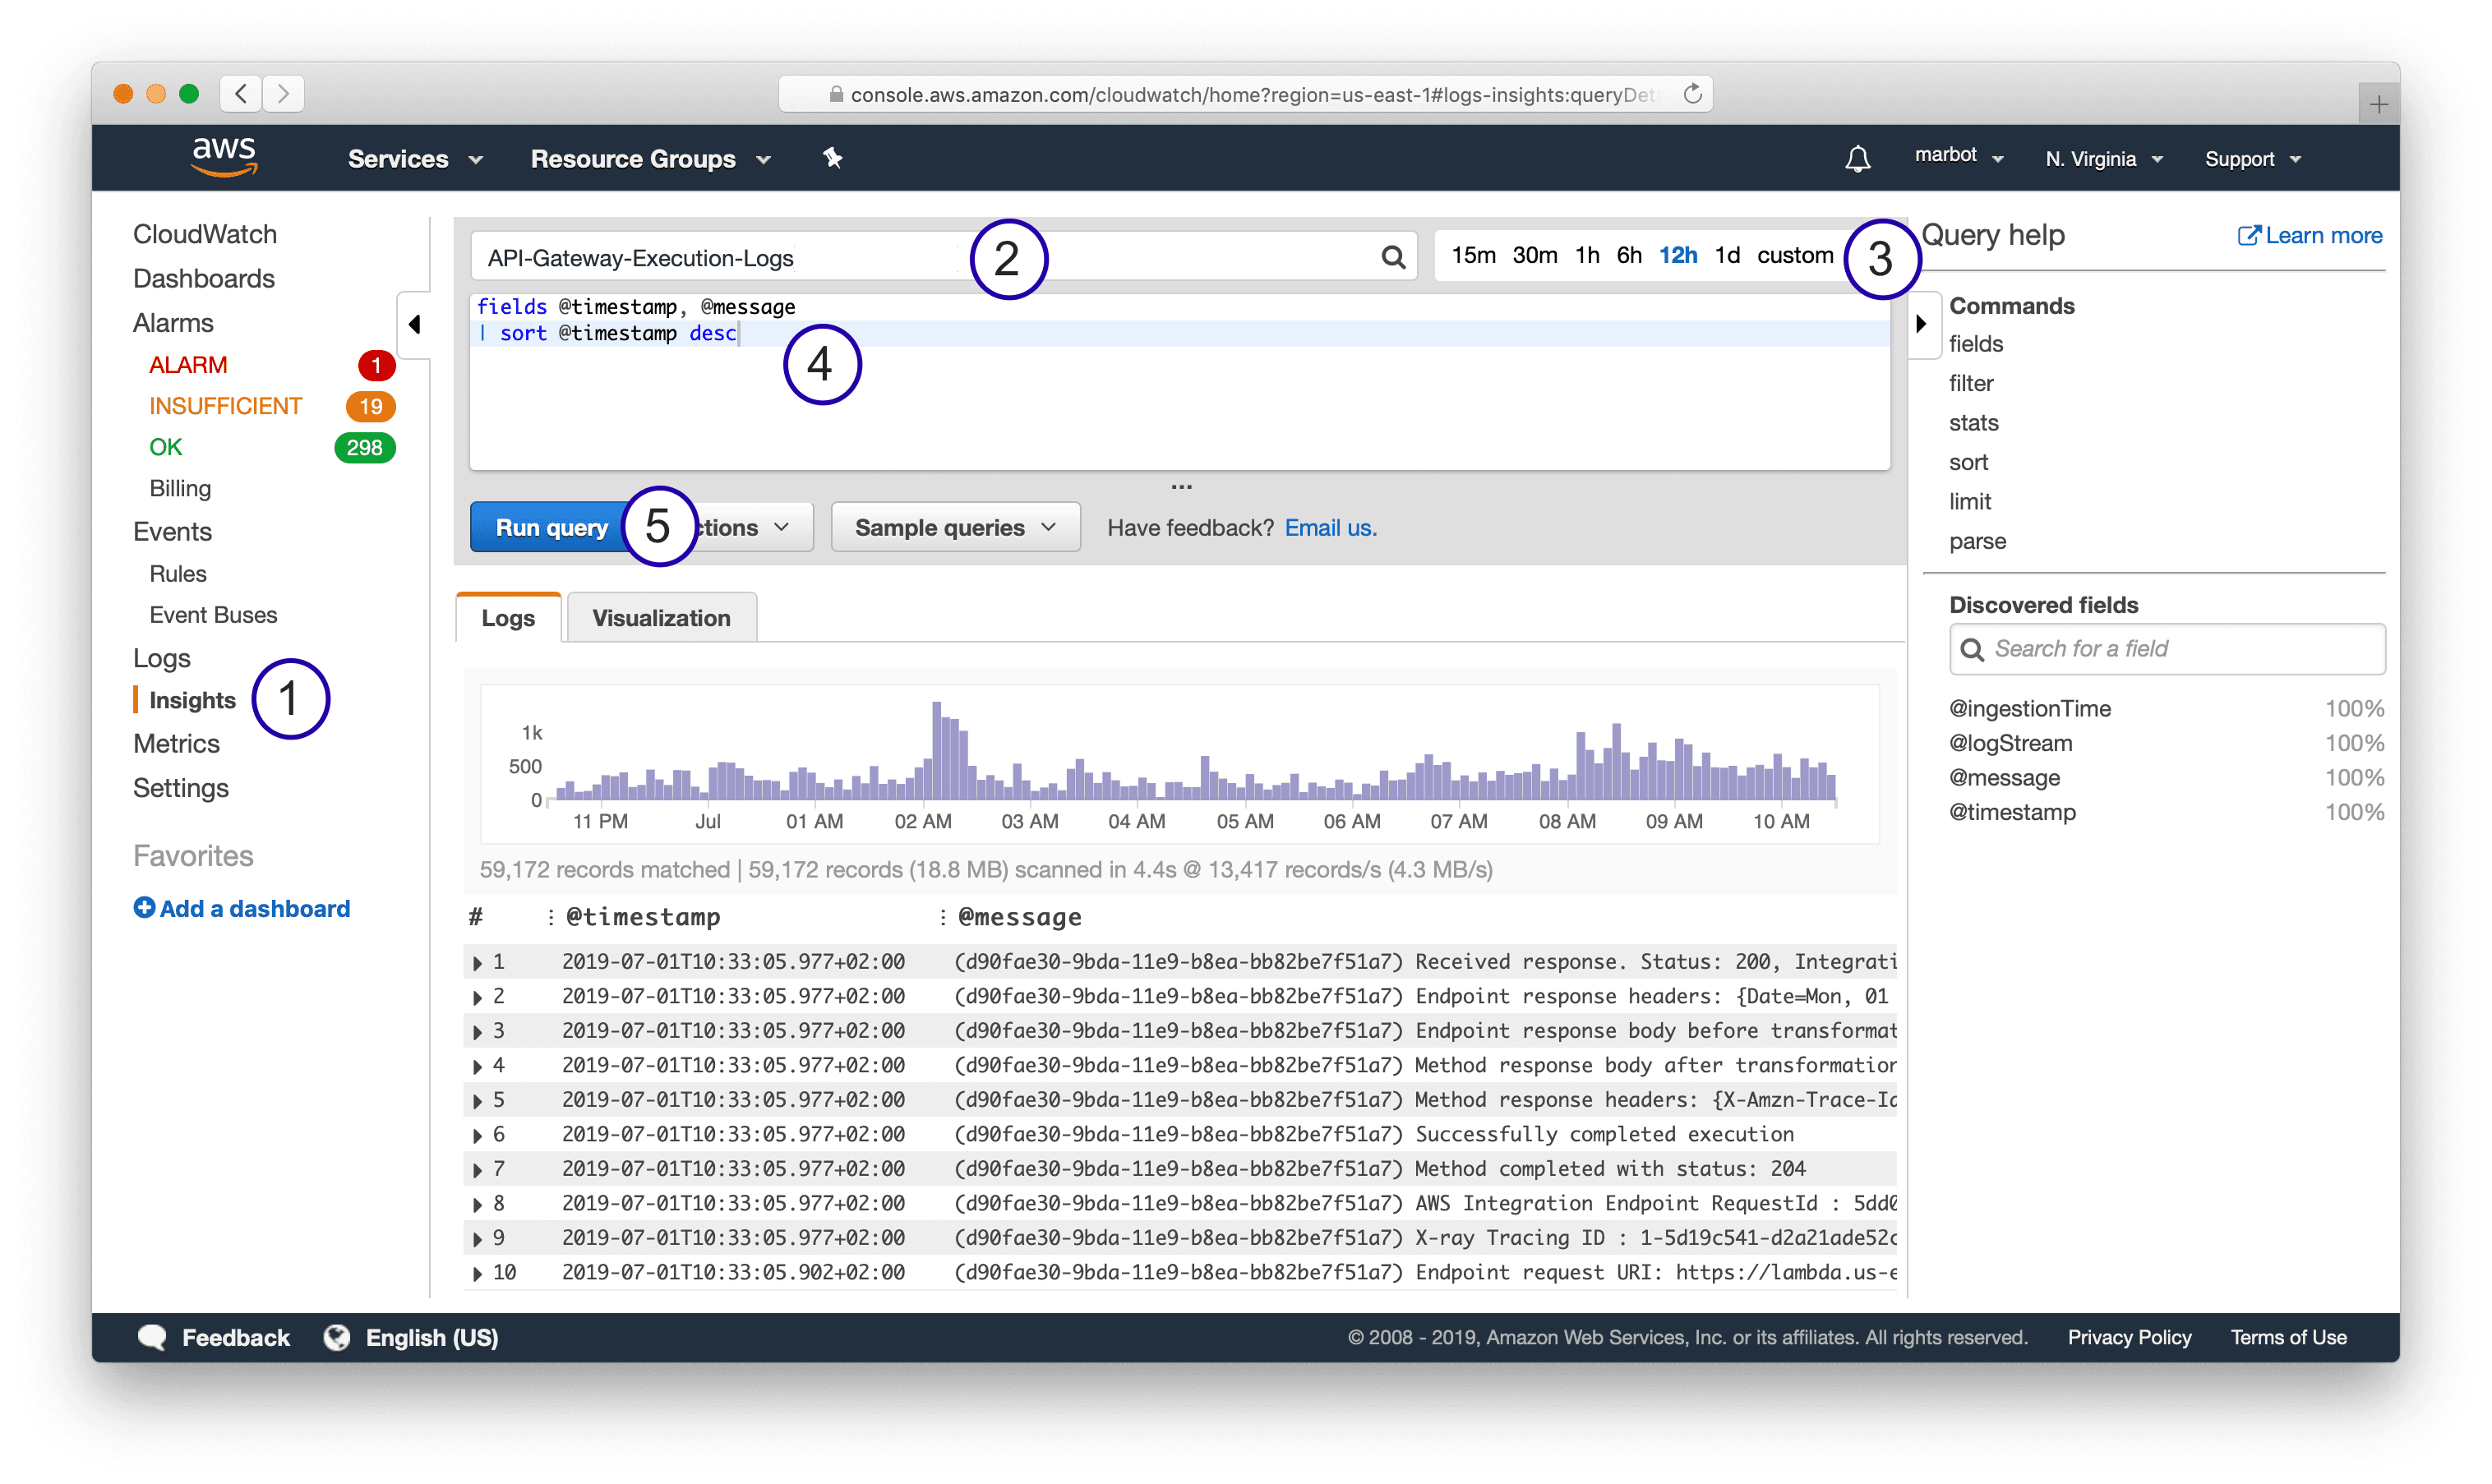
As shown in the following screenshot, five steps are needed to query log messages with CloudWatch Logs Insights.
- Open CloudWatch Logs Insights.
- Select a log group.
- Select a relative or absolute timespan.
- Type in a query.
- Press the Run query button.

The following snippet shows a simple query which fetches all log messages and displays the fields @timestamp and @message - both default fields - sorted by @timestamp.
fields @timestamp, @message |
CloudWatch Logs supports both plain text messages as well as structured (JSON) messages.
Query and parse plain text log messages
The API Gateway sends plain text log messages to CloudWatch Logs. The following snippet shows a log message indicating that the API Gateway received a response from a downstream integration.
Received response. Status: 200, Integration latency: 78 ms |
The following query filters only the log messages containing Received response..
fields @timestamp, @message |
You can also use a regular expression to filter log messages, as shown in the following example.
fields @timestamp, @message |
To analyze plain text log messages it is helpful to parse essential values. For example, the following query parses the status code @status and latency @latency with the help of a regular expression.
fields @timestamp, @message, @latency, @status |
When you do have control over the system that produces log messages, I highly recommend sending structured log messages instead of plain text messages. The following section shows queries for JSON log messages.
Query JSON log messages
A structured log message contains a log message as well as a JSON object with structured data.
For example, the log event consist of a message …
Processing event. |
… and structured data.
{ |
Querying structured data is much simpler compared to plain text log messages — no need to write regular expressions to filter and parse data.
The following query filters log messages based on the fields action and stage, both parsed by CloudWatch Logs automatically.
fields , |
It is helpful to sort the log messages by the stream as well. Because otherwise log messages from different Lambda invocations, EC2 instances, … will show up together.
fields @timestamp, @message |
Scrolling through endless lines of log messages is not very helpful when debugging. Luckily, you can even visualize log messages with CloudWatch Logs Insights.
How to visualize logs?
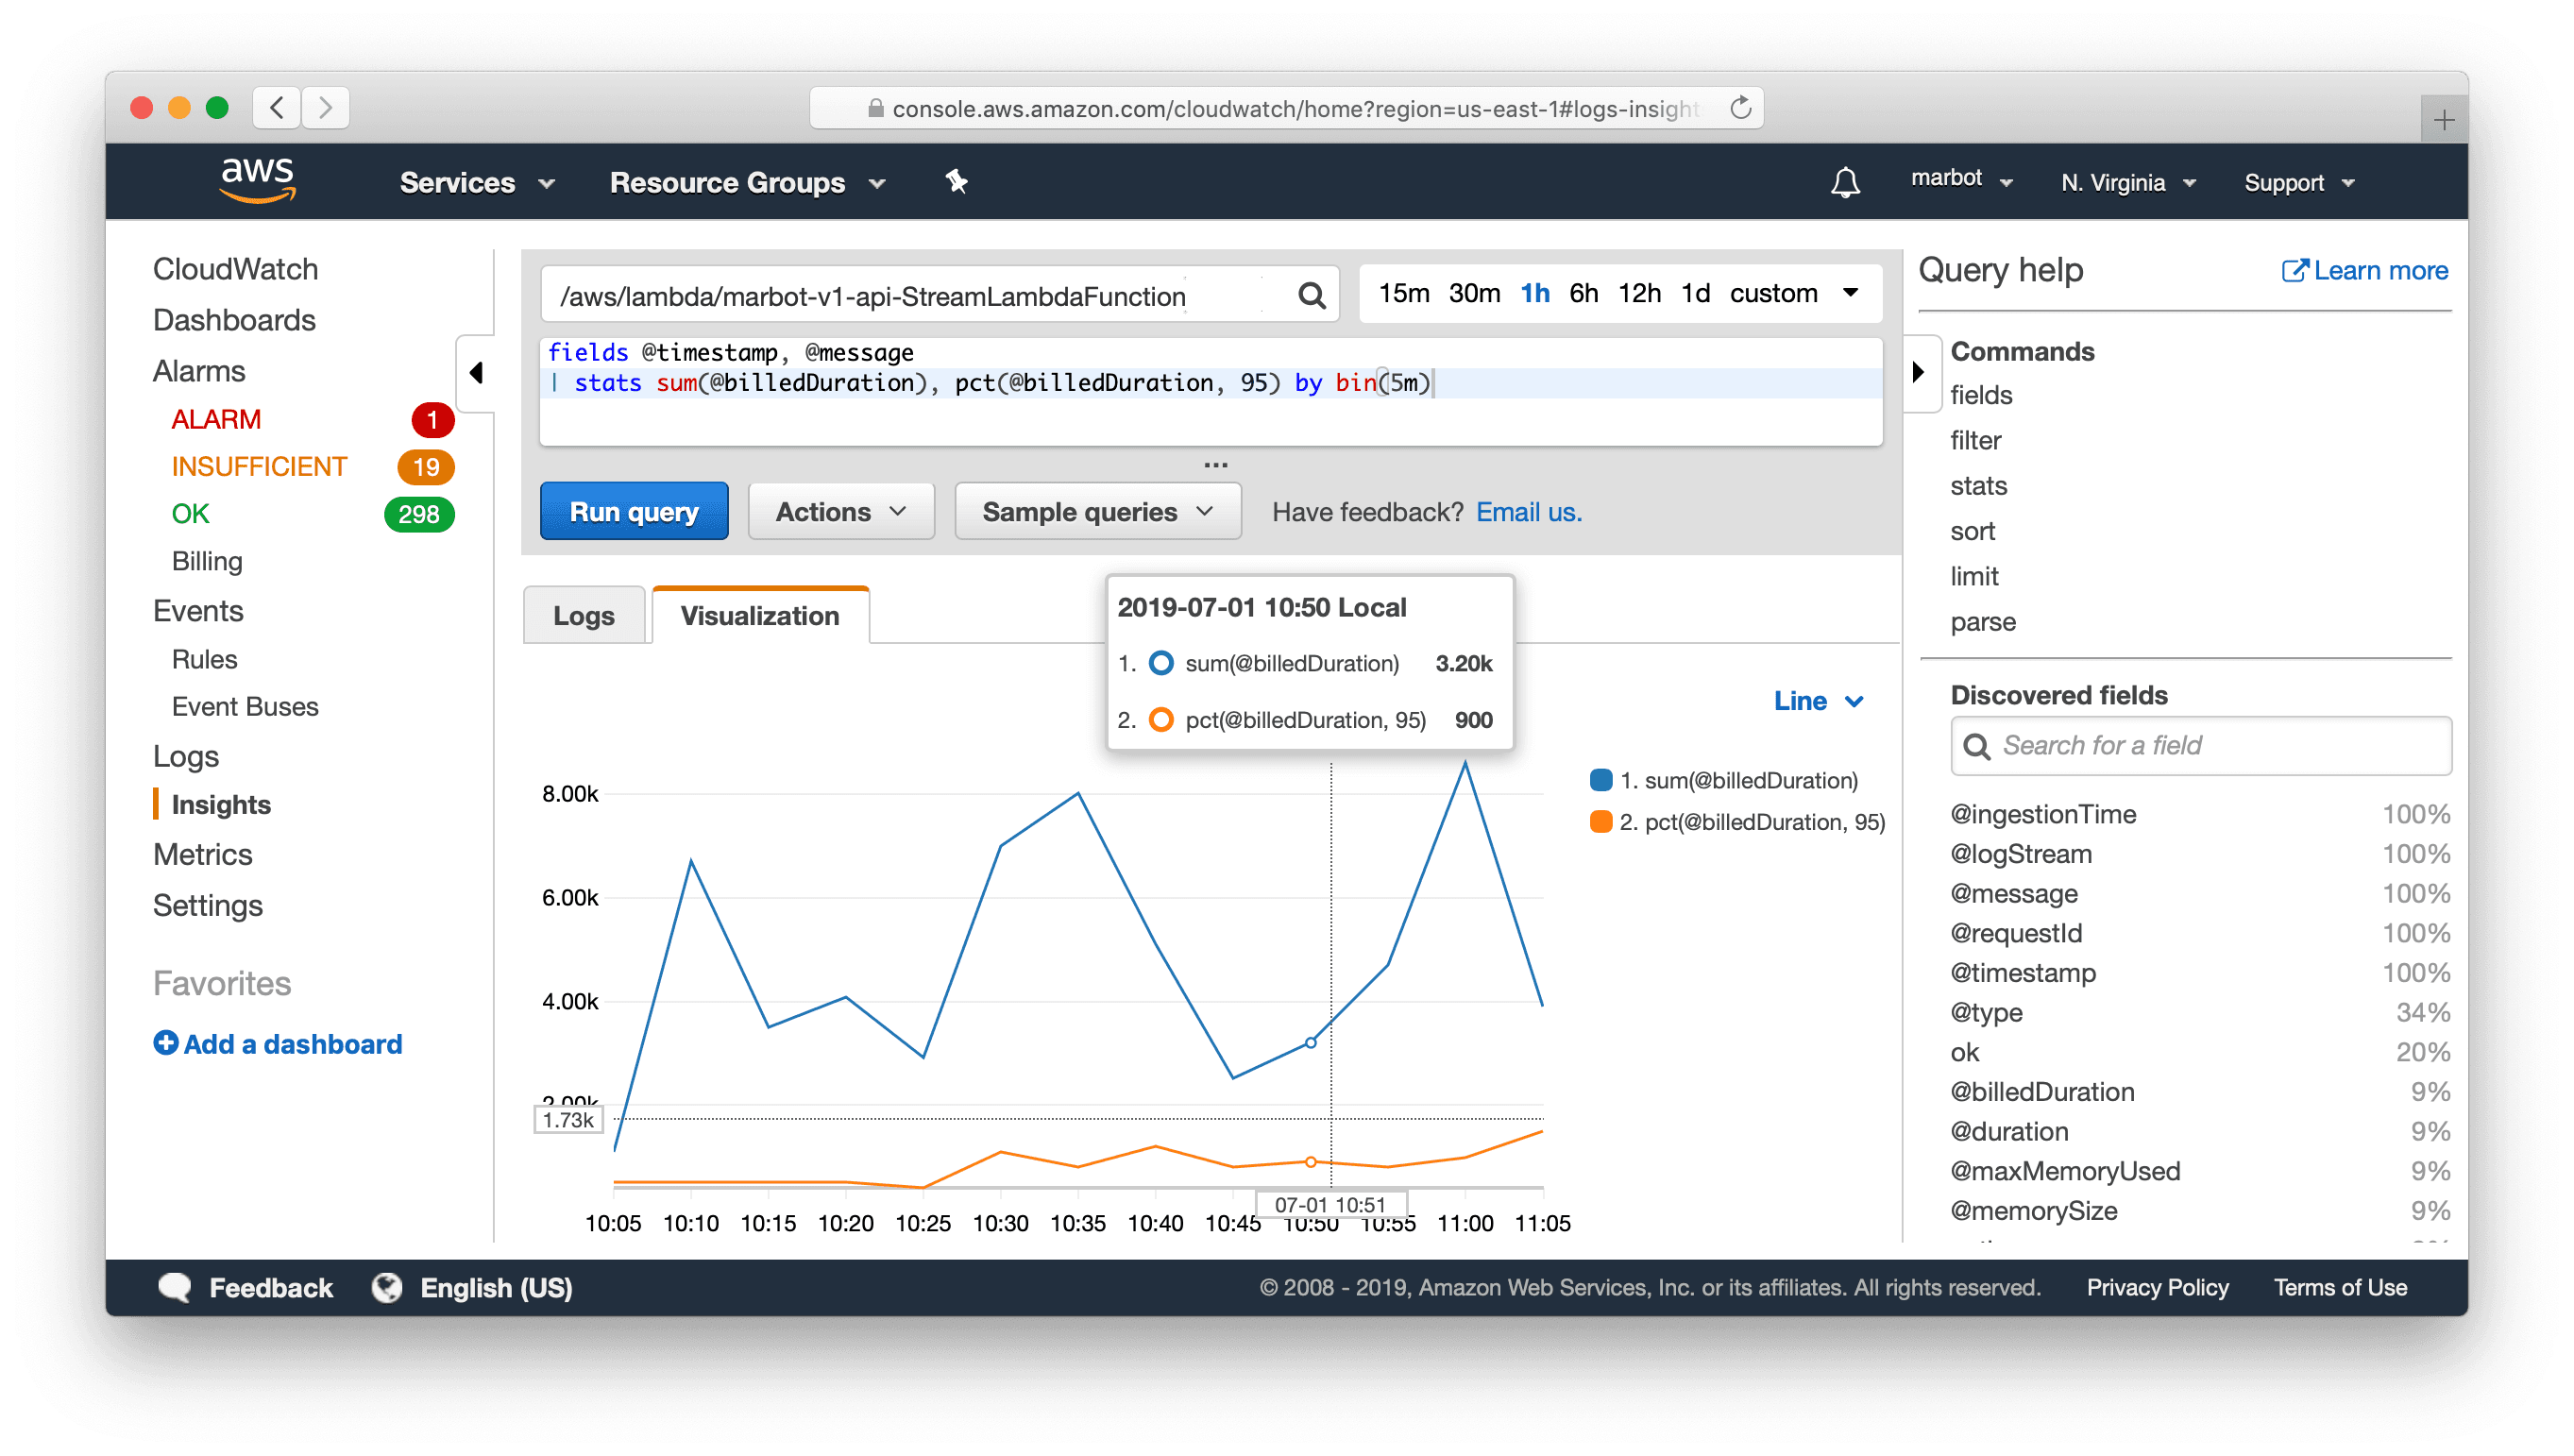
The following query creates two statistics to visualize the billed duration of Lambda function invocations: sum the sum of the duration of all invocations, as well as the 95 percentile (pct) the duration of all invocations. The data is grouped into 5-minute buckets.
Use the query on any log group of a Lambda function.
fields @timestamp, @message |
The following screenshot shows the result of the visualized query.

Visualizing logs is also possible with plain text log messages.
You already got to know the log message from the API Gateway before.
Received response. Status: 200, Integration latency: 78 ms |
The following query creates a visualization including the count of responses as well as the 95 percentile of the latency.
fields @timestamp, @message, @latency, @status |
Limitations
Compared to other solutions like Elastic Stack (Elasticsearch + Kibana), Loggly, Splunk, and Sumo Logic, CloudWatch Logs Insights has a few limitations:
- A query cannot analyze data from multiple log groups.
- The ability to visualize data is limited.
Summary
The query and visualization capabilities of Insights have upgraded CloudWatch Logs substantially. The fact that CloudWatch Logs and Insights is billed per usage (storage, data ingestion, analyzed data) is a huge benefit.
