How to create a customized CloudWatch Dashboard with CloudFormation

Andreas Wittig – 25 Sep 2019

Which metrics are essential to evaluate the state of your cloud infrastructure? Probably a lot. A dashboard allows you to keep an eye on all these metrics. For example, I like to monitor the following metrics for a typical 3-tier web application with the help of a CloudWatch dashboard:

  • load balancer: client-side and server-side error rates
  • load balancer: target response latency and number of requests
  • compute: CPU and memory utilization
  • database: query and I/O throughput

How to create a customized CloudWatch Dashboard with CloudFormation?

But how to create a customized CloudWatch Dashboard with CloudFormation? Doing so is possible with a simple CloudFormation template. However, I choose to use a custom resource to be more flexible when generating the dashboard. The following steps are needed to create a CloudWatch dashboard with a custom resource.

  1. Create a CloudFormation template and add a Lambda-backed custom resource.
  2. Write the code creating, updating, and deleting a CloudWatch dashboard.
  3. Generate the JSON code describing the customized dashboard.

You will learn how to do so in more detail next.

Create a template and add a Lambda-backed custom resource

First of all, create a CloudFormation template. Add the identifiers of the resource you want to monitor to the parameters section as shown in the following code snippet.

---
Parameters:
DashboardName:
Description: 'The name for the dashboard.'
Type: String
AlbFullName:
Description: 'The full-name of the ALB. (optional)'
Type: String
Default: ''
RdsClusterName:
Description: 'The RDS Aurora Cluster name. (optional)'
Type: String
Default: ''
# ...

Next, you need to add three resources to your template.

  1. A custom resource Dashboard to manage the CloudWatch dashboard.
  2. A Lambda function CustomResourceFunction executing your source code for the custom resource.
  3. An IAM role CustomResourceRole assumed by the Lambda function to write logs as well as creating, updating and deleting CloudWatch dashboards.
# ...
Resources:
Dashboard:
Type: 'Custom::Dashboard'
Version: '1.0'
Properties:
DashboardName: !Ref DashboardName
AlbFullName: !Ref AlbFullName
RdsClusterName: !Ref RdsClusterName
ServiceToken: !GetAtt 'CustomResourceFunction.Outputs.Arn'
CustomResourceFunction:
Type: 'AWS::Lambda::Function'
Properties:
Code: './dashboard.js'
Handler: 'dashboard.handler'
MemorySize: 512
Role: !GetAtt 'CustomResourceRole.Arn'
Runtime: 'nodejs8.10'
Timeout: 30
CustomResourceRole:
Type: 'AWS::IAM::Role'
Properties:
AssumeRolePolicyDocument:
Version: '2012-10-17'
Statement:
- Effect: Allow
Principal:
Service: 'lambda.amazonaws.com'
Action: 'sts:AssumeRole'
Policies:
- PolicyName: 'customresource'
PolicyDocument:
Statement:
- Effect: Allow
Action:
- 'logs:CreateLogStream'
- 'logs:PutLogEvents'
Resource: !GetAtt 'LogGroup.Arn'
- Effect: Allow
Action:
- 'cloudwatch:DeleteDashboards'
- 'cloudwatch:PutDashboard'
Resource: '*'

And now we’ll write some code.

Implement creating, updating, and deleting a CloudWatch dashboard

The following code snippet shows parts of dashboard.js including the handler which creates, updates, or deletes a CloudWatch dashboard. The built-in modules aws-sdk and cfn-response are used.

const AWS = require('aws-sdk');
const cloudwatch = new AWS.CloudWatch({apiVersion: '2010-08-01'});
const response = require('cfn-response');

exports.handler = (event, context, cb) => {
console.log(`Executing function with event: ${JSON.stringify(event)}`);
const error = (err) => {
console.log('Error', err);
response.send(event, context, response.FAILED);
};
if (event.RequestType === 'Delete') {
cloudwatch.deleteDashboards({DashboardNames: [event.ResourceProperties.DashboardName]}, function(err) {
if (err) {
error(err);
} else {
response.send(event, context, response.SUCCESS, {}, event.ResourceProperties.DashboardName);
}
});
} else if (event.RequestType === 'Create' || event.RequestType === 'Update') {
cloudwatch.putDashboard({
DashboardName: event.ResourceProperties.DashboardName,
DashboardBody: JSON.stringify(generateDashboard(event))
}, function(err) {
if (err) {
error(err);
} else {
console.log(`Created/Updated dashboard ${event.ResourceProperties.DashboardName}.`);
response.send(event, context, response.SUCCESS, {}, event.ResourceProperties.DashboardName);
}
});
} else {
error(new Error(`unsupported request type: ${event.RequestType}`));
}
};

There is only one step missing: you need to add widgets to the dashboard.

Generate the JSON code describing the customized dashboard

To do so, you need to generate a JSON file describing your dashboard in Dashboard Body Structure and Syntax . I recommend to create your dashboard by clicking through the AWS Management Console first. Generating the dashboard’s JSON with the help of the View/edit source action gives you a good starting point.

The following code snippet shows the generateDashboard function, which generates the JSON defining a CloudWatch dashboard with two widgets:

  1. Widget ALB: total number of incoming requests as well as the target latency in 99 and 95 percentile
  2. Widget RDS: maximum read and write IOPS as well as the serverless capacity of the database
function generateDashboard(event) {
let widgets = [];
if (event.ResourceProperties.AlbFullName) {
widgets.push({
type: 'metric',
properties: {
metrics: [
['AWS/ApplicationELB', 'TargetResponseTime', 'LoadBalancer', event.ResourceProperties.AlbFullName, {stat: 'p99', label: '99 PCTL'}],
['...', {'stat': 'p95', 'label': '95 PCTL' }],
[{expression: 'SUM(METRICS(\"req\"))/60/5', label: 'Requests', id: 'reqs', yAxis: 'right'}],
['AWS/ApplicationELB', 'RequestCount', 'LoadBalancer', event.ResourceProperties.AlbFullName, {stat: 'Sum', id: 'req', visible: false }]
],
view: 'timeSeries',
stacked: true,
region: event.ResourceProperties.Region,
title: 'ALB Requests + Latency',
period: 300
}
});
}
if (event.ResourceProperties.RdsClusterName) {
widgets.push({
type: 'metric',
properties: {
metrics: [
['AWS/RDS', 'VolumeReadIOPs', 'DBClusterIdentifier', event.ResourceProperties.RdsClusterName, {stat: 'Maximum'}],
['.', 'VolumeWriteIOPs', '.', '.', {'stat': 'Maximum'}],
['.', 'ServerlessDatabaseCapacity', '.', '.', {stat: 'Maximum', yAxis: 'right'}]
],
view: 'timeSeries',
region: event.ResourceProperties.Region,
title: 'RDS IOPS + Capacity'
}
});
}
// Add additional widgets here ...

let dashboard = {widgets: []};
for (let w in widgets) {
let widget = widgets[w];
let x = (w % 2) * 12;
let y = Math.floor(w/2);
widget.x = x;
widget.y = y;
widget.width = 12;
widget.height = 6;
dashboard.widgets.push(widget);
}

console.log(`Generated dashboard: ${JSON.stringify(dashboard)}`);
return dashboard;
}

That’s it. The following screenshot illustrates the results.
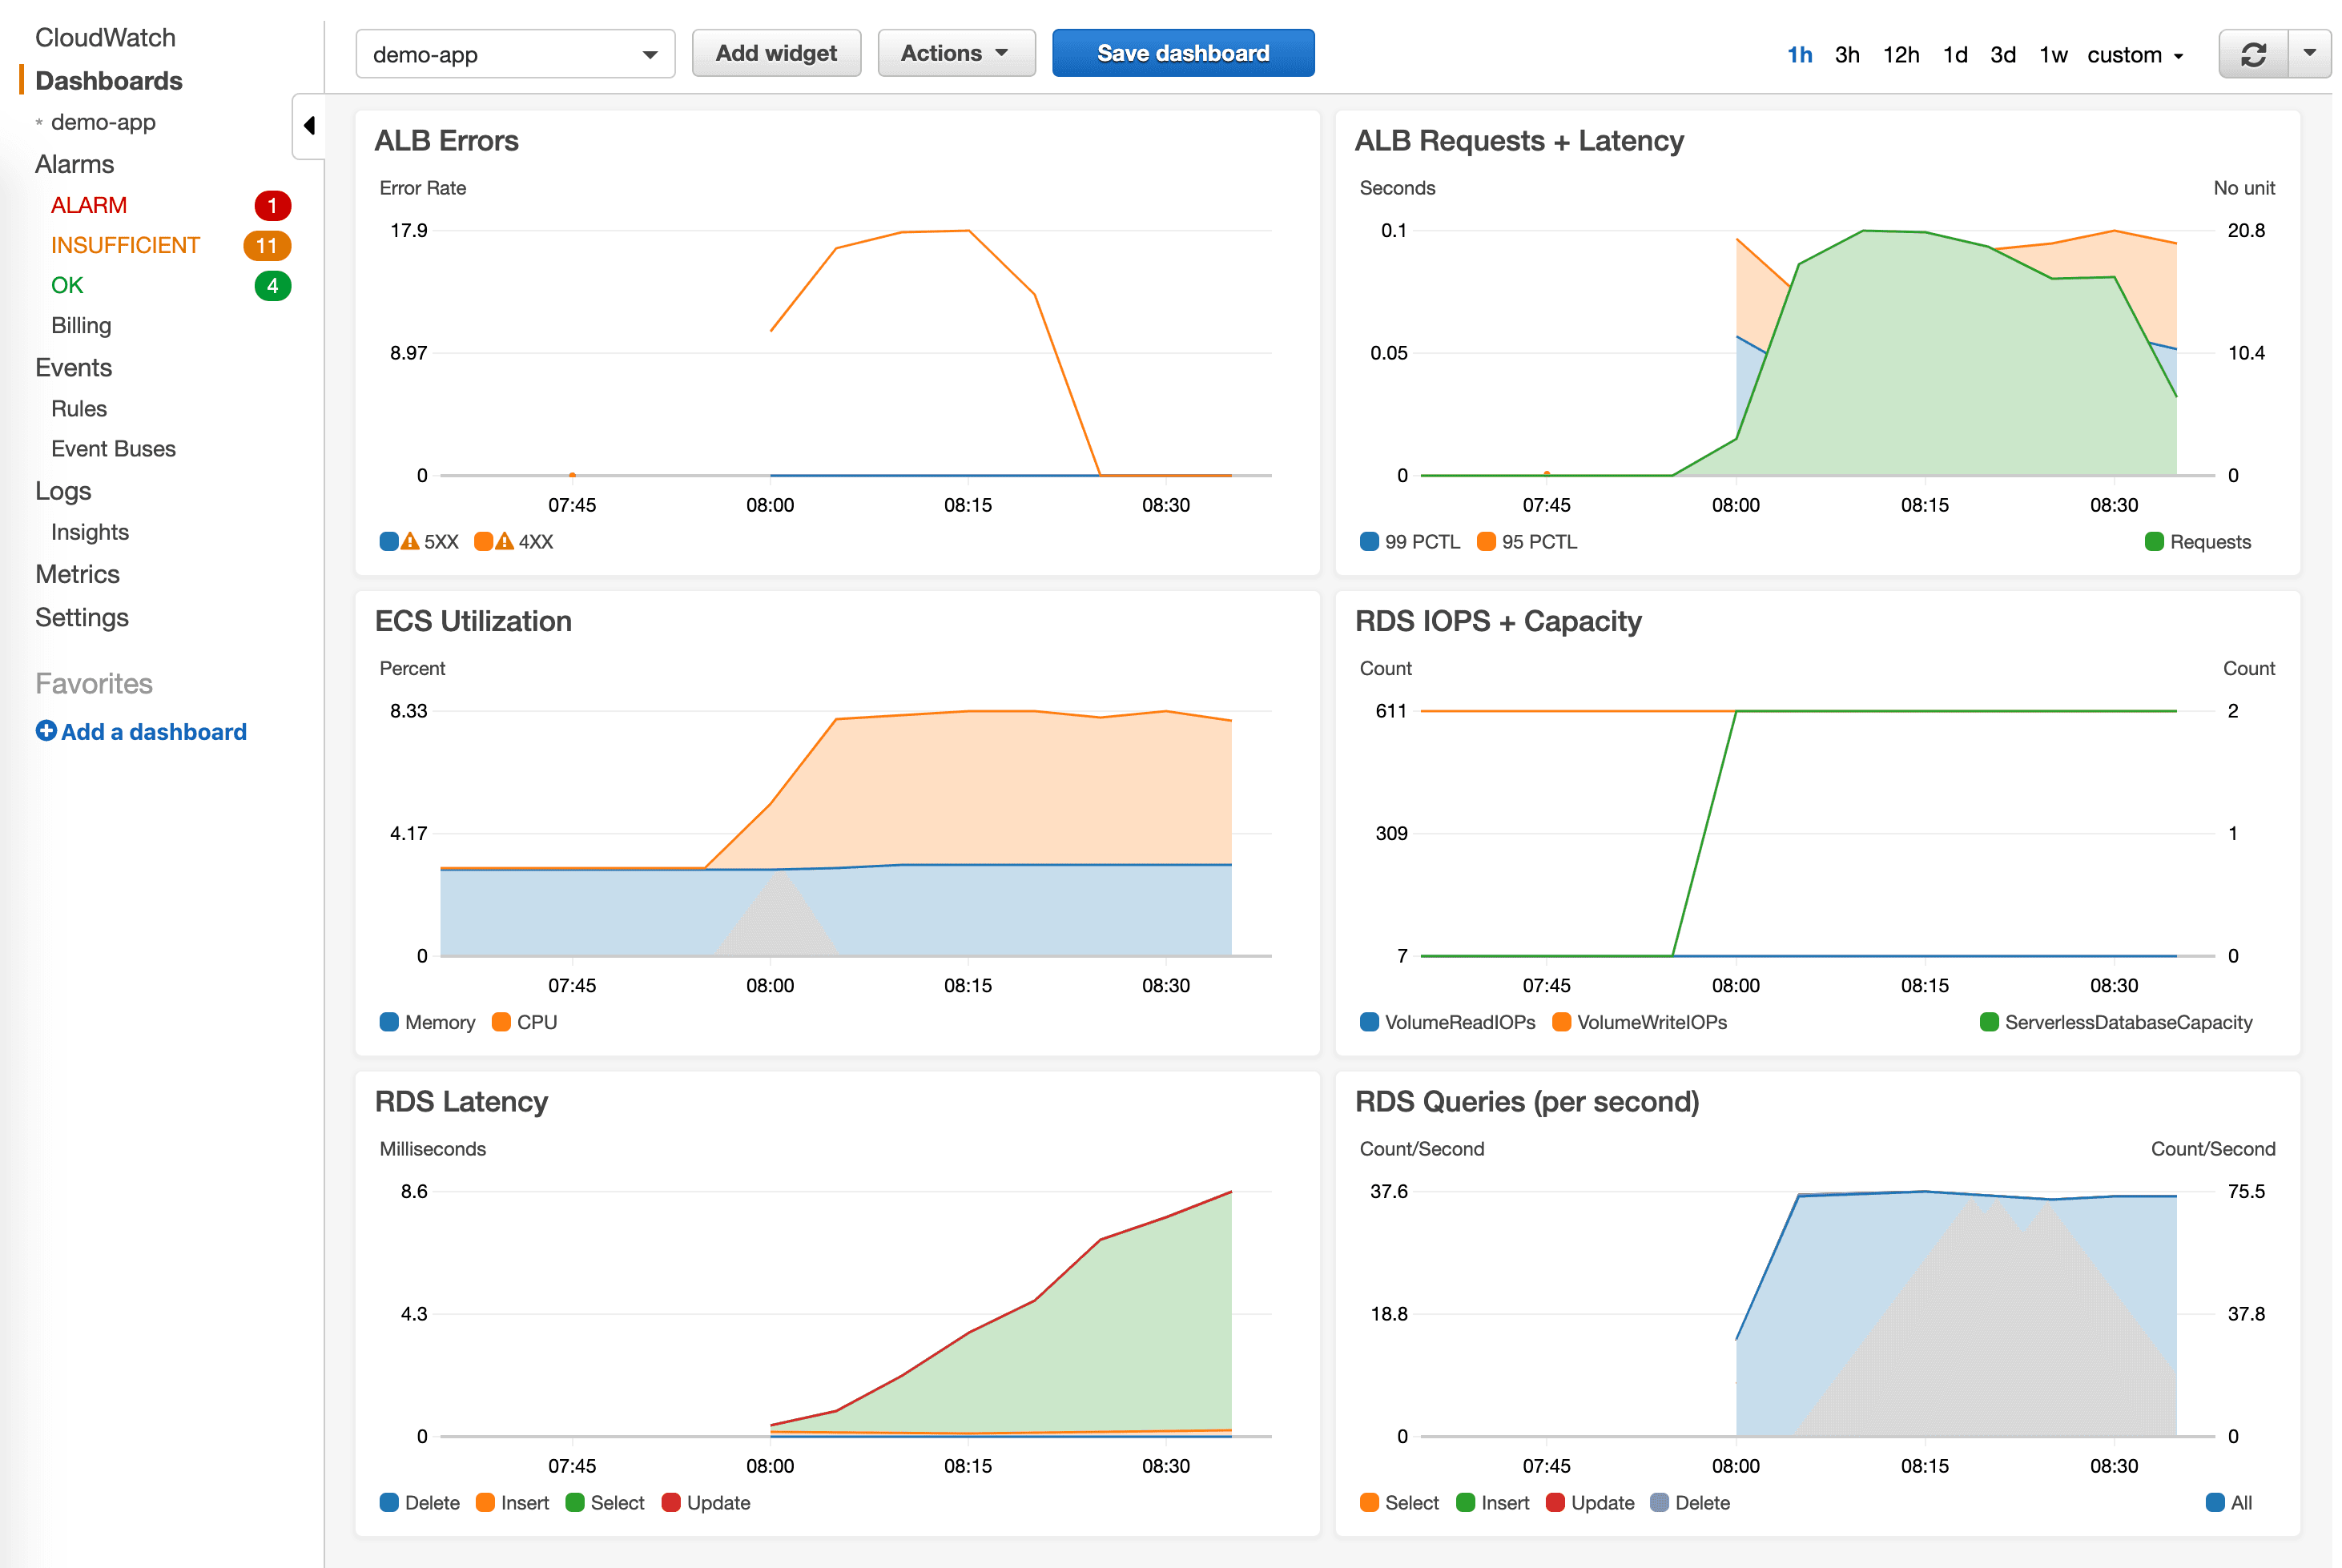
CloudWatch Dashboard

Looking for a more advanced example? Check out the source code of our CloudFormation modulecfn-modules/cloudwatch-dashboard.

Let’s knuckle down! 👩‍💻

Andreas Wittig

Andreas Wittig

I’ve been building on AWS since 2012 together with my brother Michael. We are sharing our insights into all things AWS on cloudonaut and have written the book AWS in Action. Besides that, we’re currently working on bucketAV,HyperEnv for GitHub Actions, and marbot.

Here are the contact options for feedback and questions.