Own your analytics data: Replacing Google Analytics with Amazon QuickSight
Making decisions based on data is compelling. Especially, when you wrestle with the most straightforward decisions like me. Google Analytics is the de-facto standard for tracking your customers while clicking through your websites and applications. I’ve made data-driven decisions to improve the user experience of our blog and applications with the help of Google Analytics for years.

However, I decided to replace Google Analytics for the following reasons:
- I want to have more flexibility in how I collect and analyze data.
- I think data minimization is key for data privacy. And I don’t agree with how Google collects and combines data.
- I want to transfer the ownership of our tracking data.
So, I looked into my toolbox full of AWS services and replaced Google Analytics with the following tools:
- Amazon CloudFront for collecting access logs.
- Amazon Simple Storage Service (S3) as my data lake to store access logs and other kinds of tracking data in the future.
- The ad-hoc analytics service Amazon Athena to query data.
- The business intelligence (BI) solution Amazon QuickSight to visualize the tracking data.
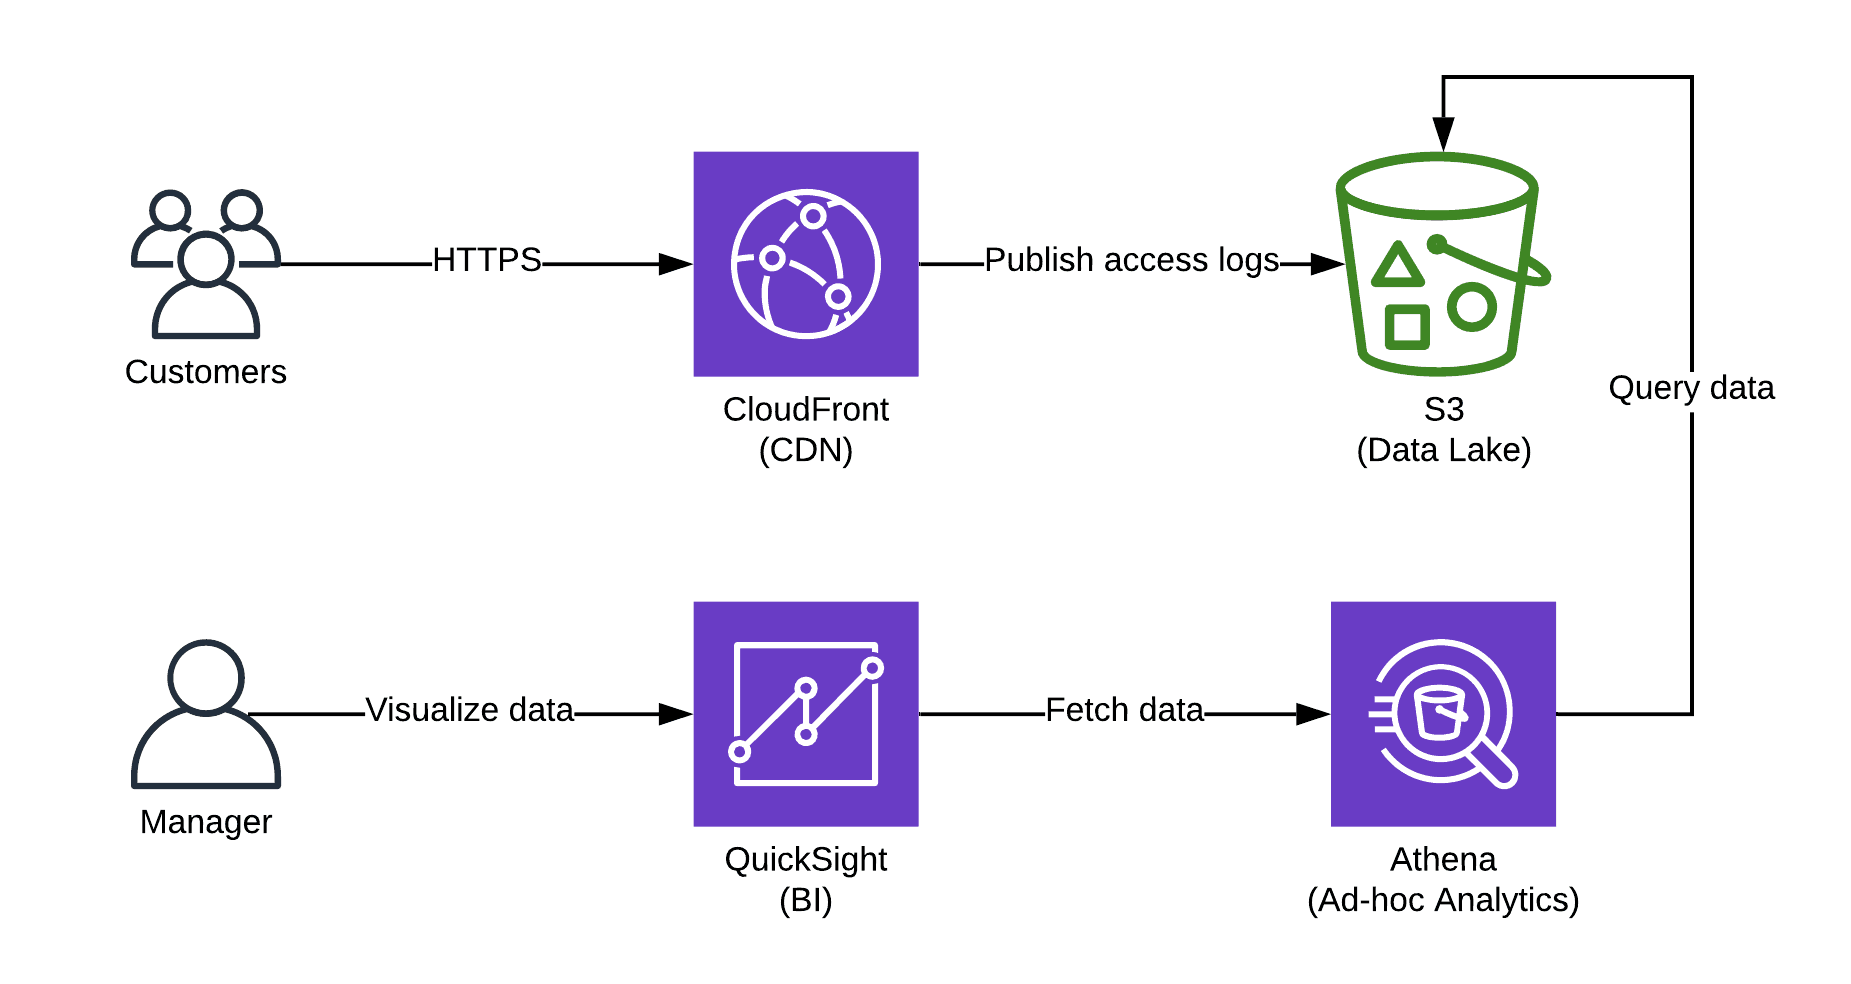
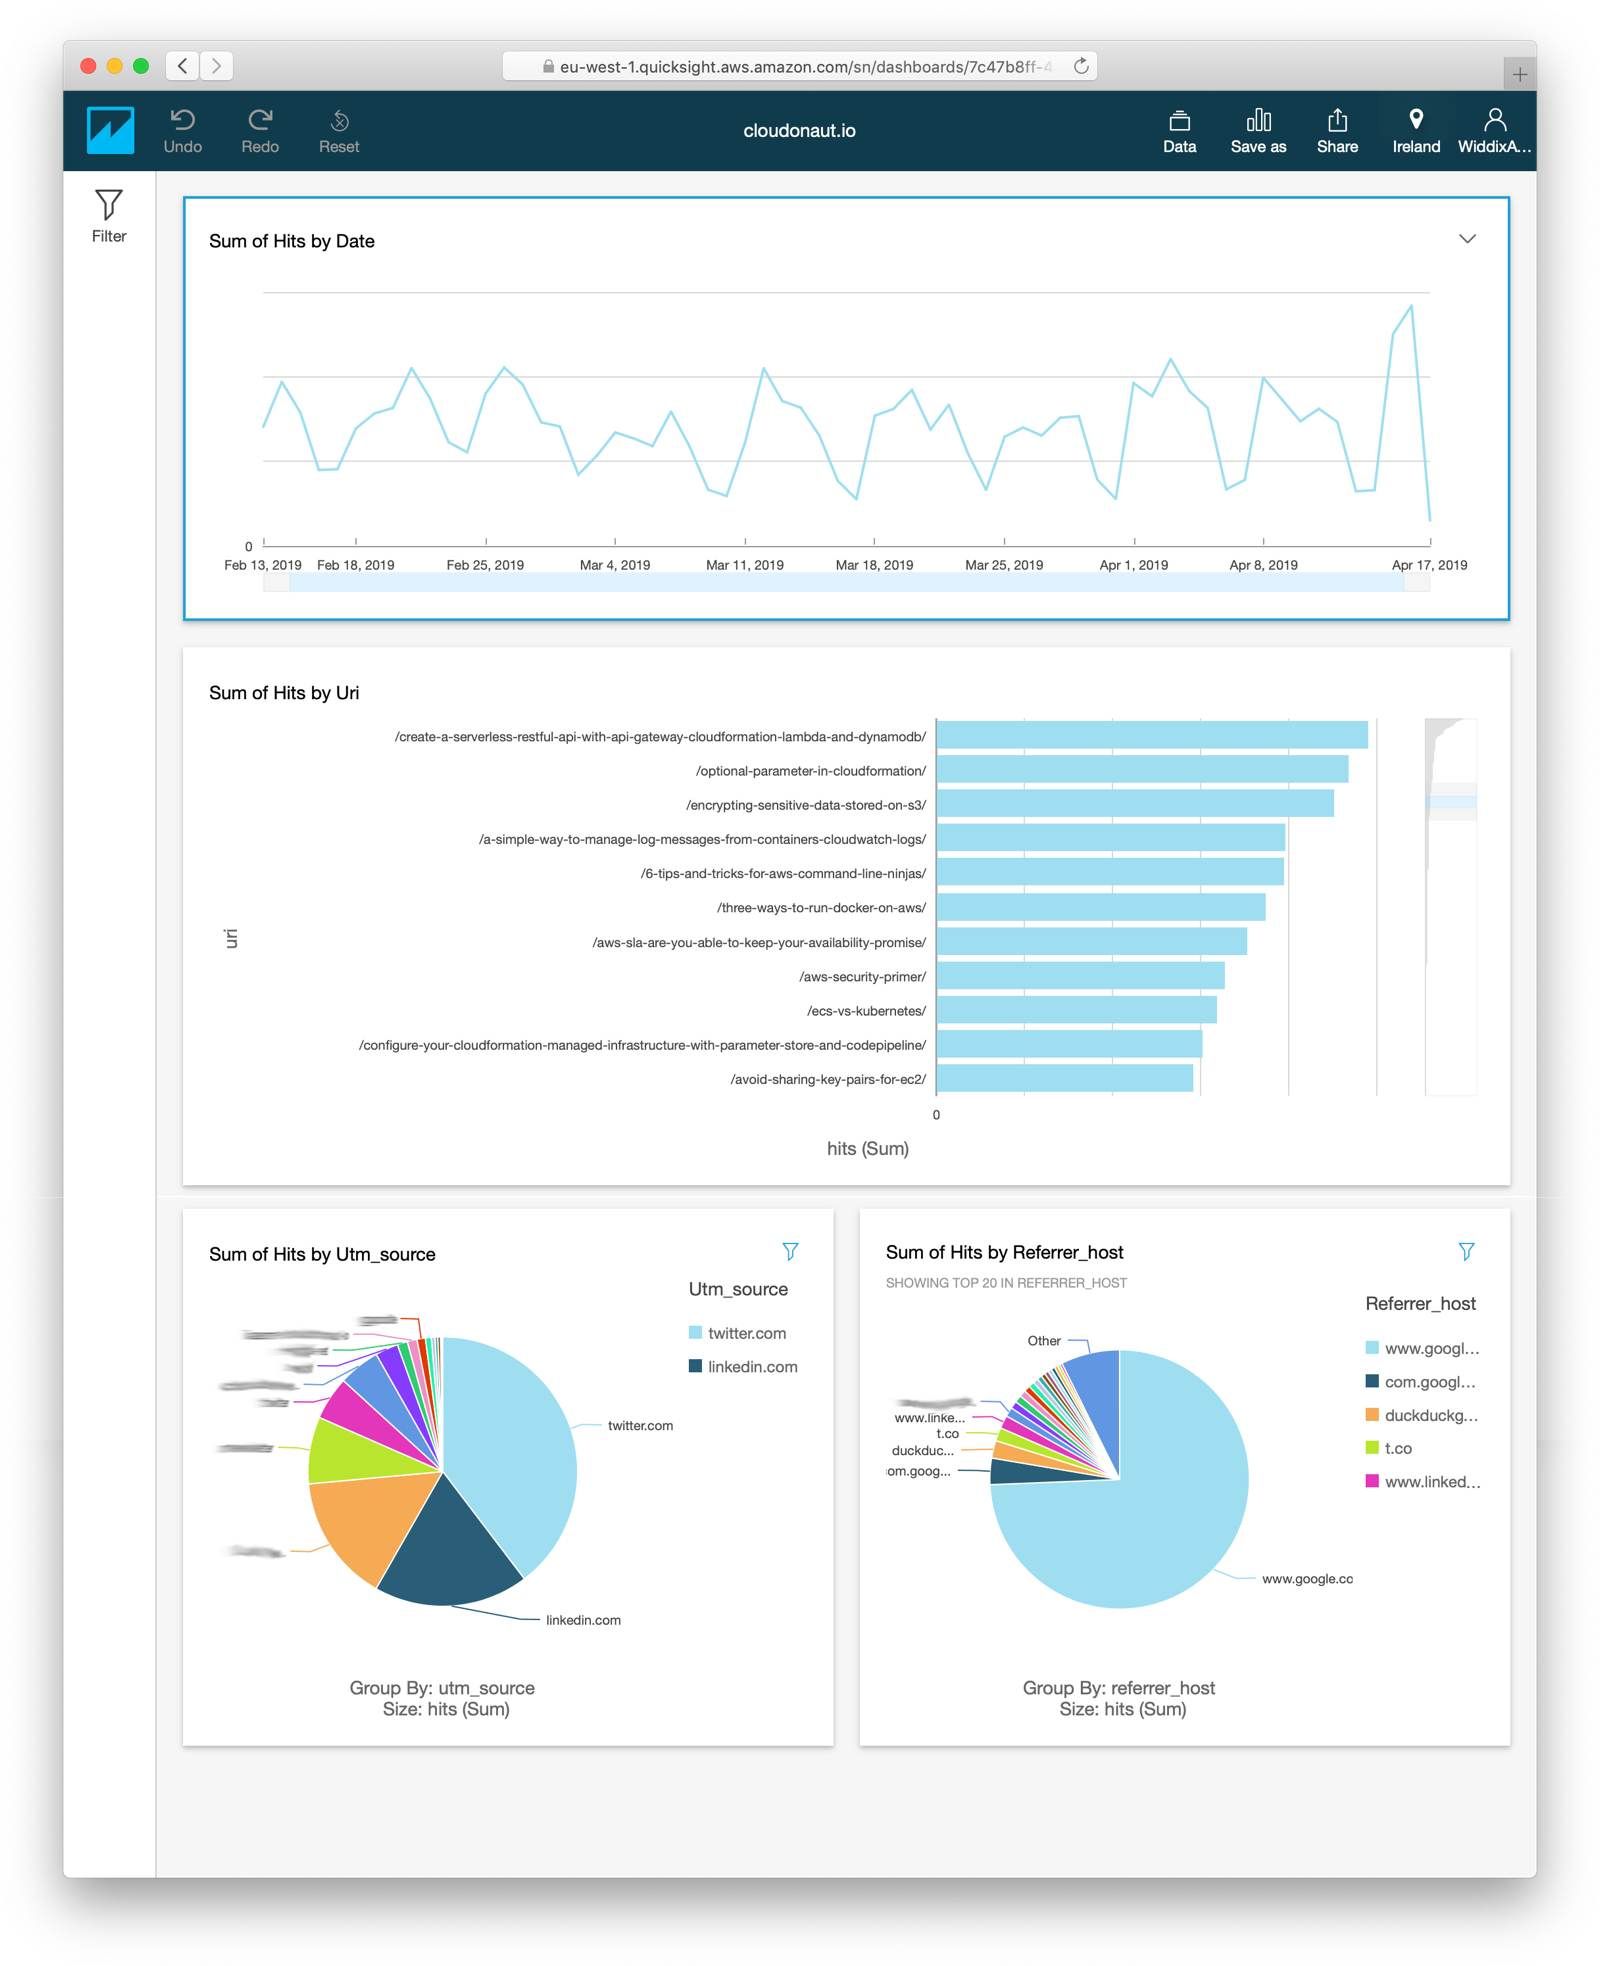
Next, I will describe how you can set up your analytics platform based on S3, Athena, and QuickSight resulting in a dashboard as shown in the following screenshot.
Collecting access logs
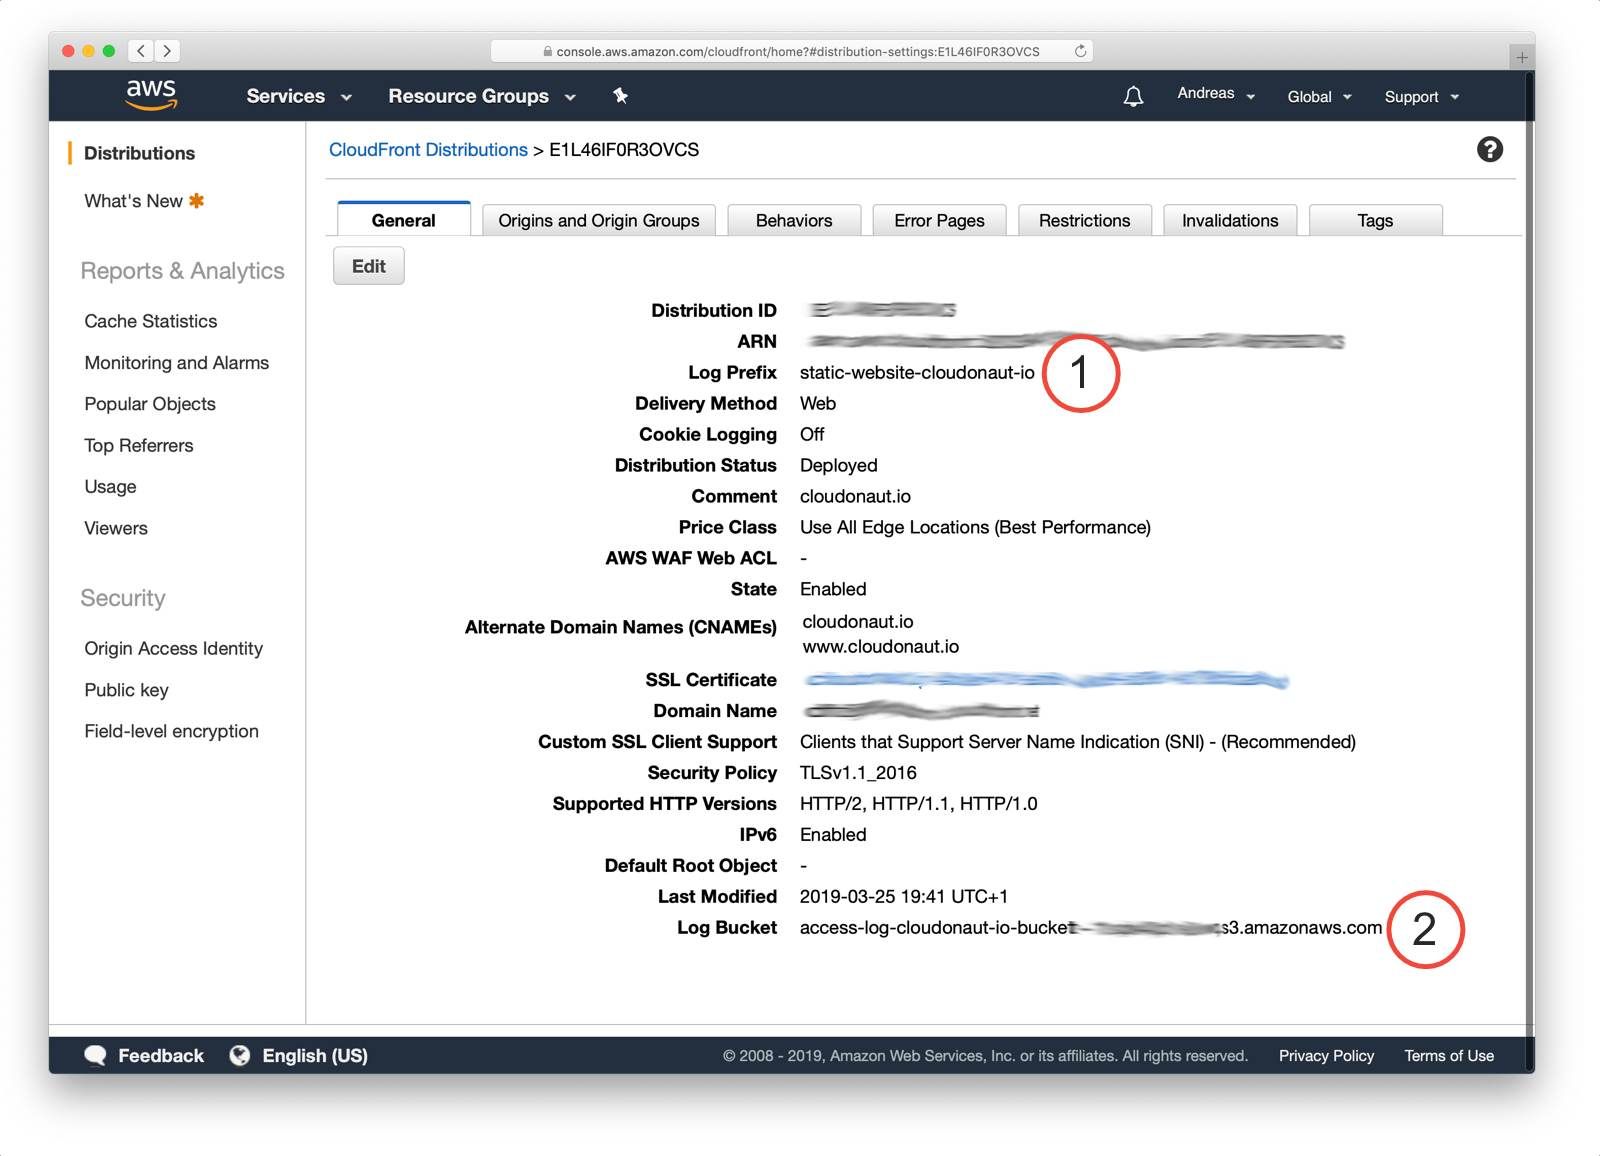
First, you need to collect data. CloudFront - as well as the Application Load Balancer - publishes access logs and ships them to S3 periodically. As shown in the following screenshot all you need to do is configuring your CloudFront distribution to upload the access logs to a specific S3 bucket (2) with a specific prefix (1) (aka. folder).
It might take some time, but in the end access logs should show up in your S3 bucket.
Querying access logs
Next, you need a way to query and analyze the access logs stored on S3. Amazon Athena enables you to run ad-hoc SQL queries on data stored on S3. You only pay for the data processed — no need to spin up any servers.
The following figure shows how to use SQL to query data with Athena.
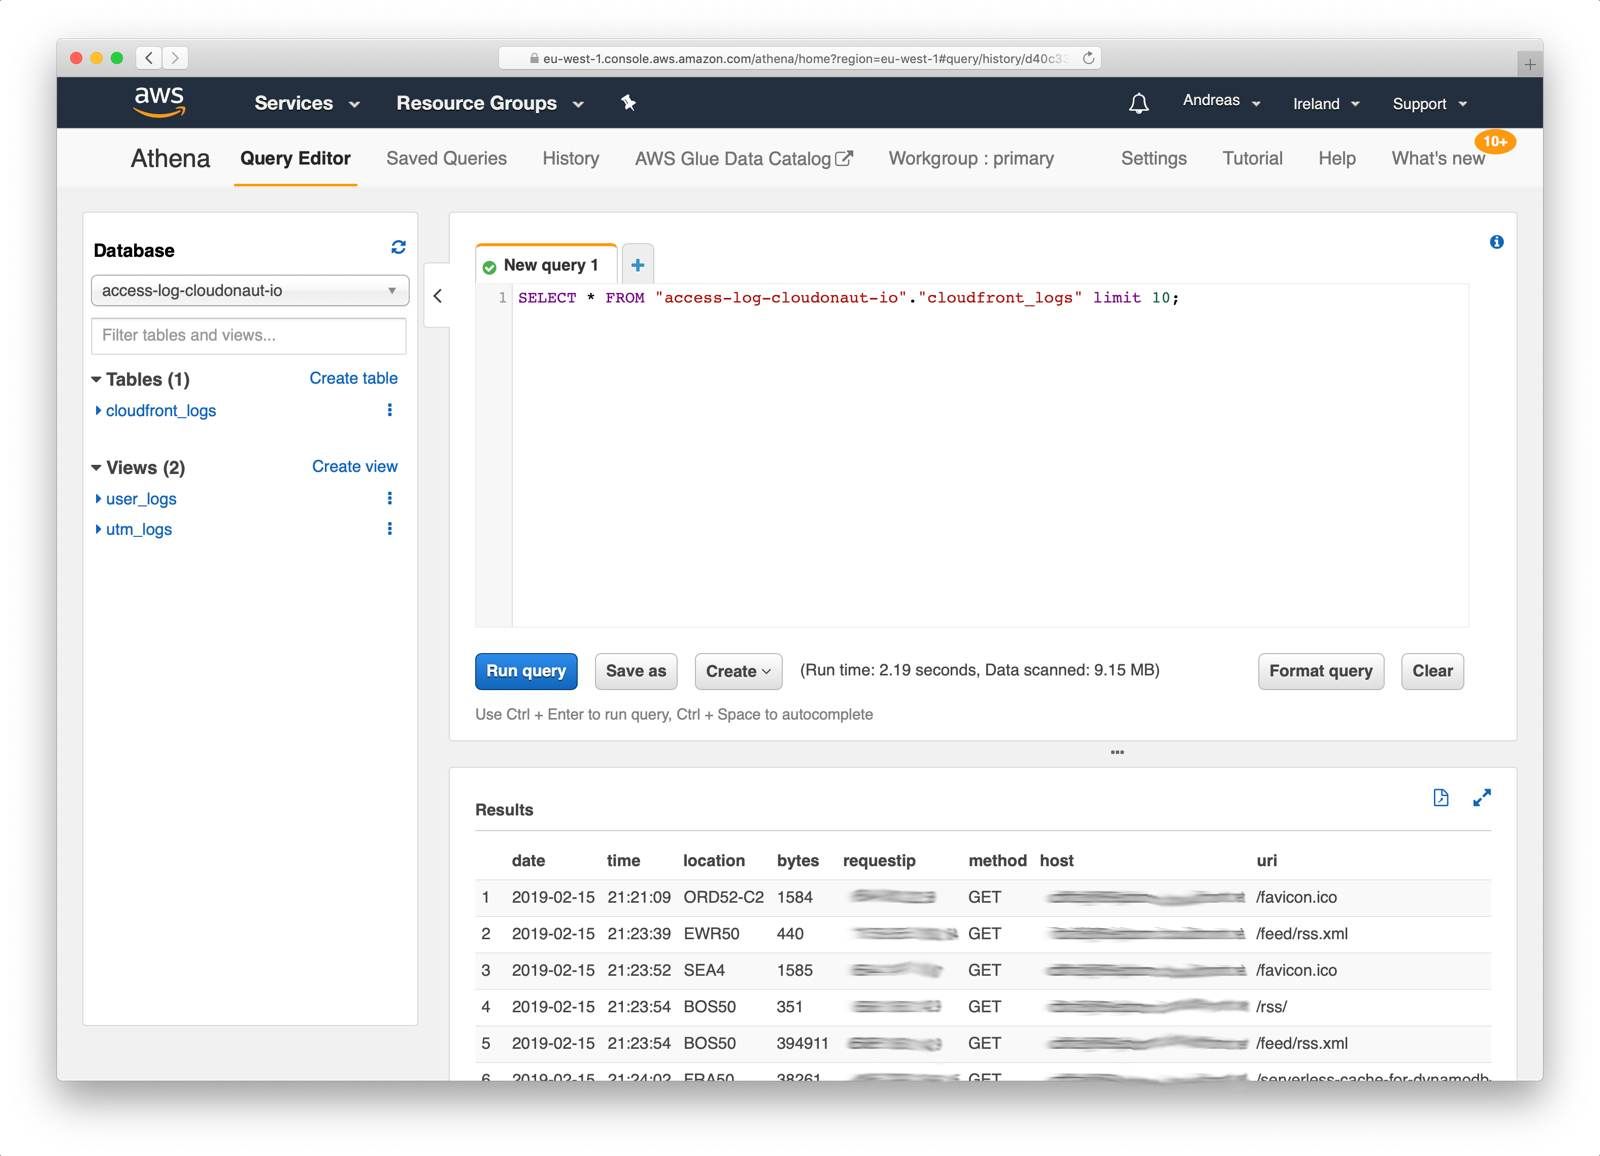
Before you can query the access logs from CloudFront, you need to create a schema (aka. table). The following query creates a table named cloudfront_logs. Make sure you are replacing <BUCKET_NAME>and <PREFIX> with the destination of your CloudFormation access logs.
CREATE EXTERNAL TABLE IF NOT EXISTS cloudfront_logs ( |
To simplify queries, you should create two views on the cloudfront_logs table.
The following query creates a view which filters access from all kind of bots (e.g., the Google bot crawling your website). You might need to filter additional bots when analyzing access logs for your website.
CREATE OR REPLACE VIEW user_logs AS SELECT * FROM cloudfront_logs |
Another view parses Urchin Tracking Module (UTM) parameters from the HTTP request. Doing so allows you to track traffic from campaigns (e.g., Google AdWords). Execute the following query to create a view which extracts the query parameters utm_source, utm_medium, utm_campaign, utm_term, and utm_content.
CREATE OR REPLACE VIEW utm_logs AS |
After you have been creating the table and two views, run queries to analyze the traffic of your website.
The following query lists the most viewed pages. Keep in mind that our pages are represented as folders, therfore we only include URIs that end with an /.
SELECT uri, COUNT(*) hits FROM user_logs |
Another query returns the number of site hits per date.
SELECT date, COUNT(*) hits |
Or you can query for site hits per Urchin Tracking Module (UTM) parameters.
SELECT utm_source, utm_medium, utm_campaign, utm_term, utm_content, COUNT(*) As hits |
Feel free to bring in your SQL expertise to write your queries to analyze the access logs.
Visualizing access logs
The final step is to visualize the data you have analyzed with the help of Athena. QuickSight is a simple-to-use BI tool focusing on visualizing data and sharing insights.
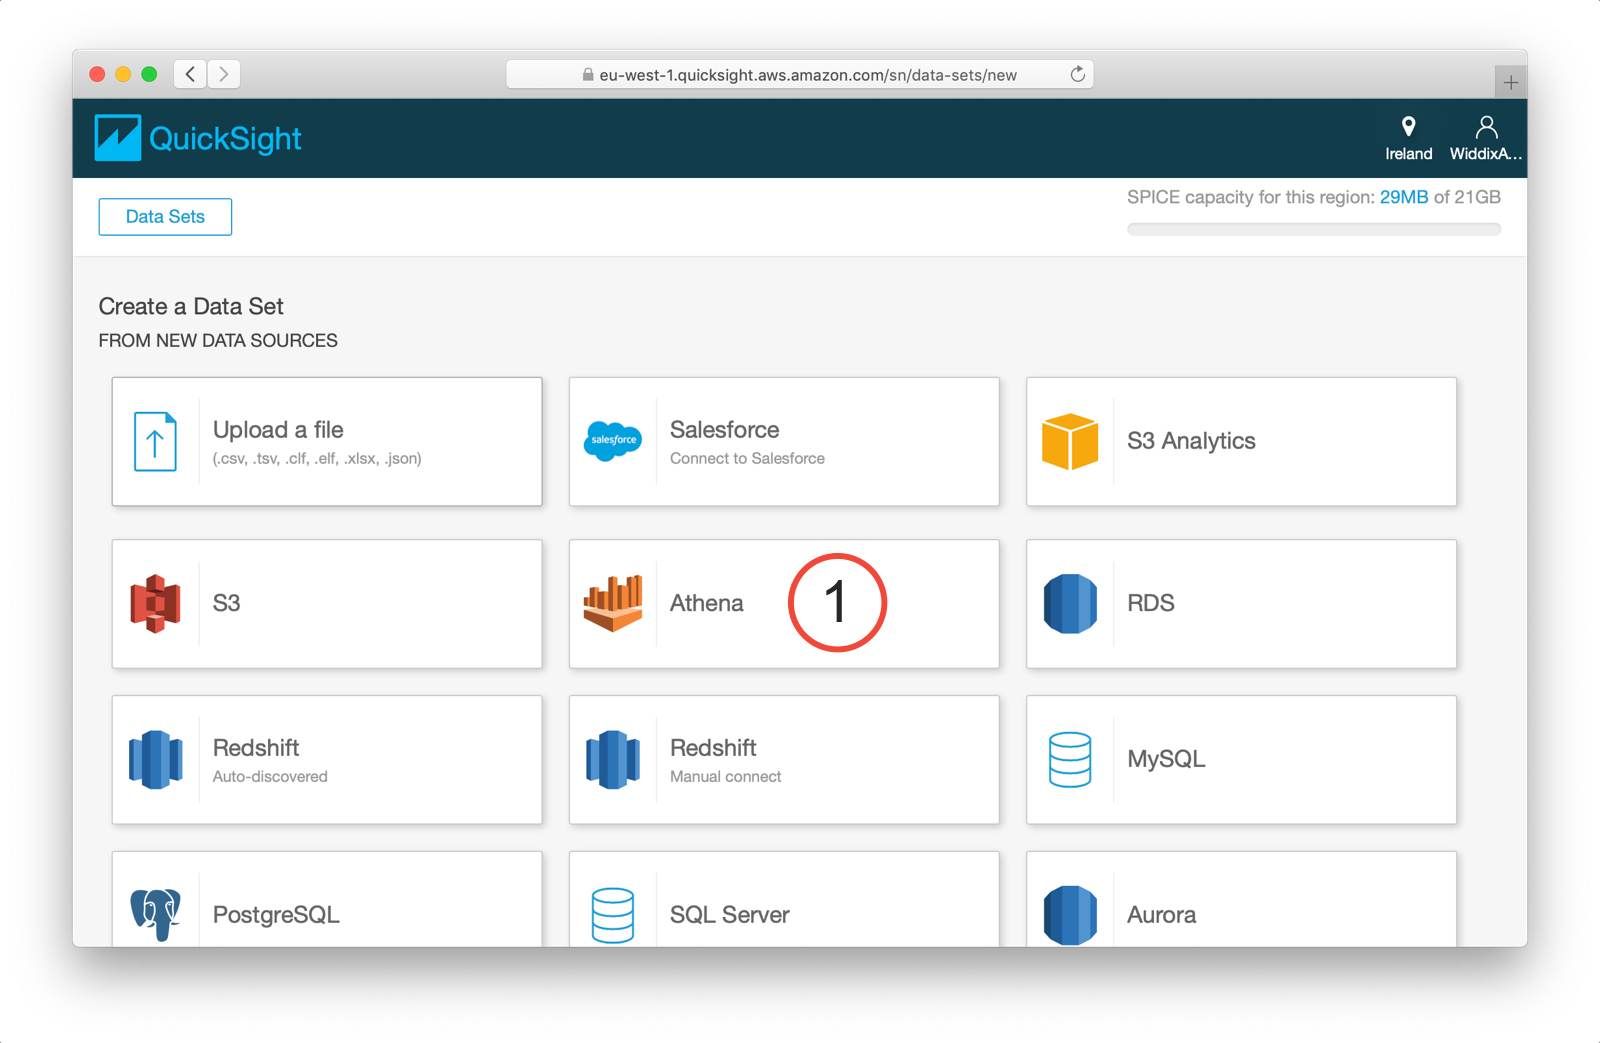
As shown in the following screenshot you need to create a data set first. QuickSight integrates with a bunch of data sources. Make sure you are choosing Athena (1) when creating a new data source.
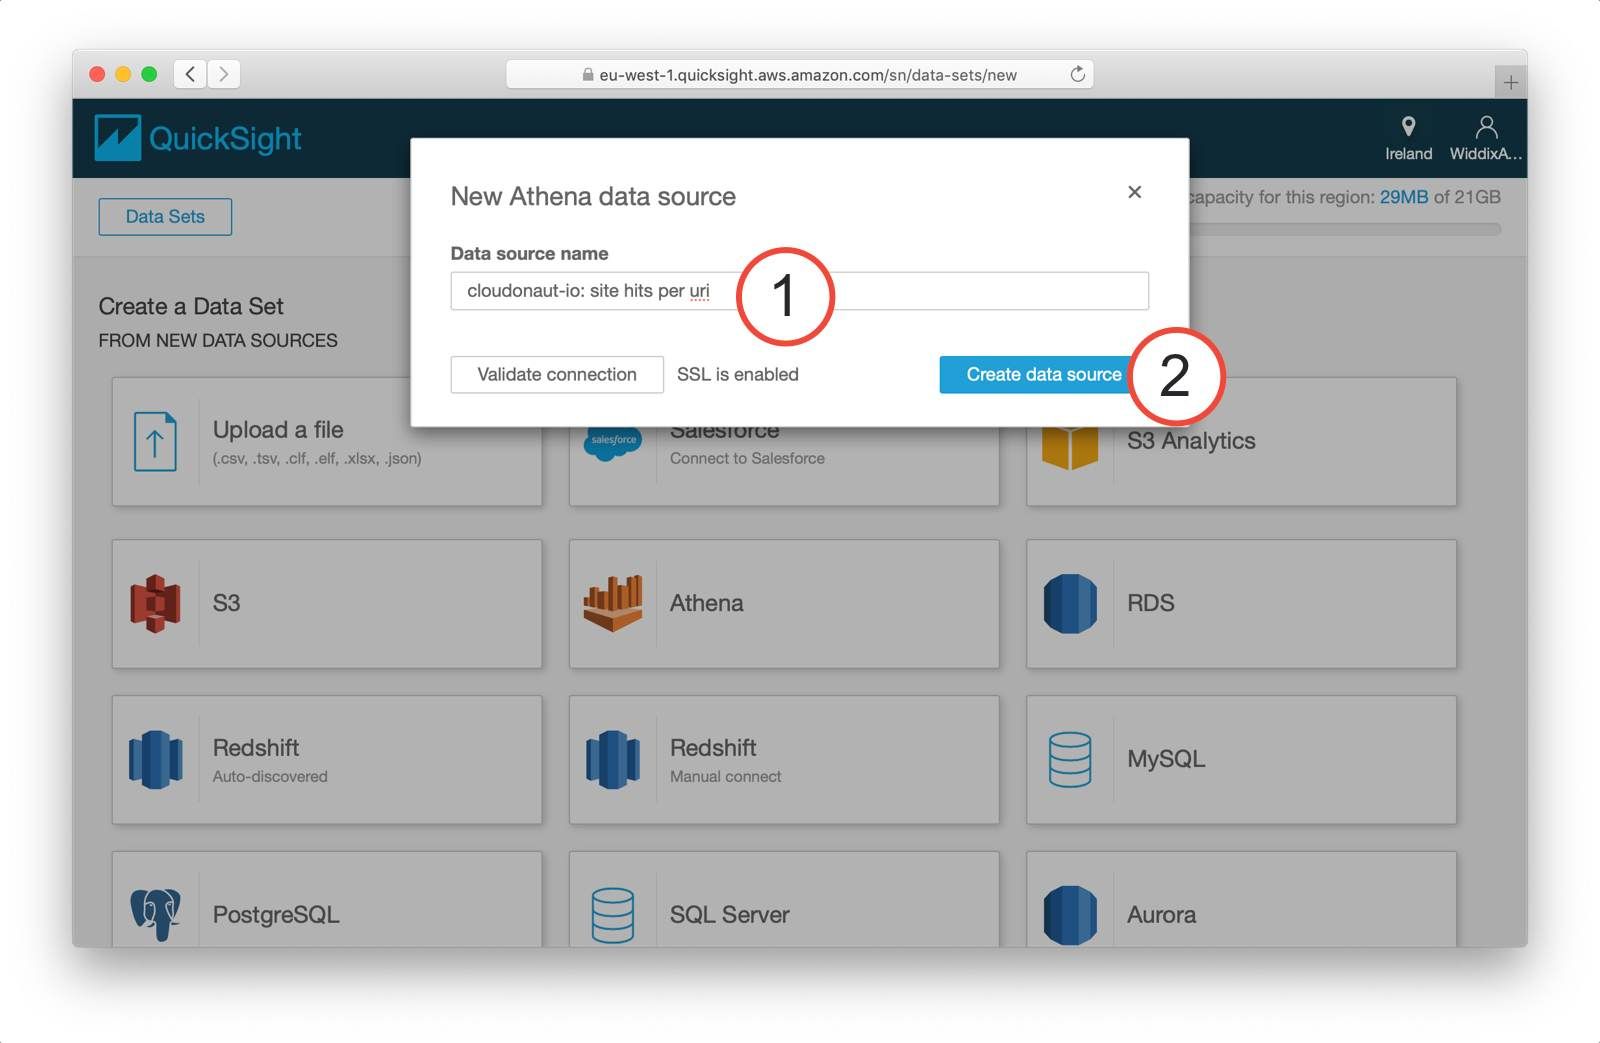
Name the data source (1) and click Create data source (2).
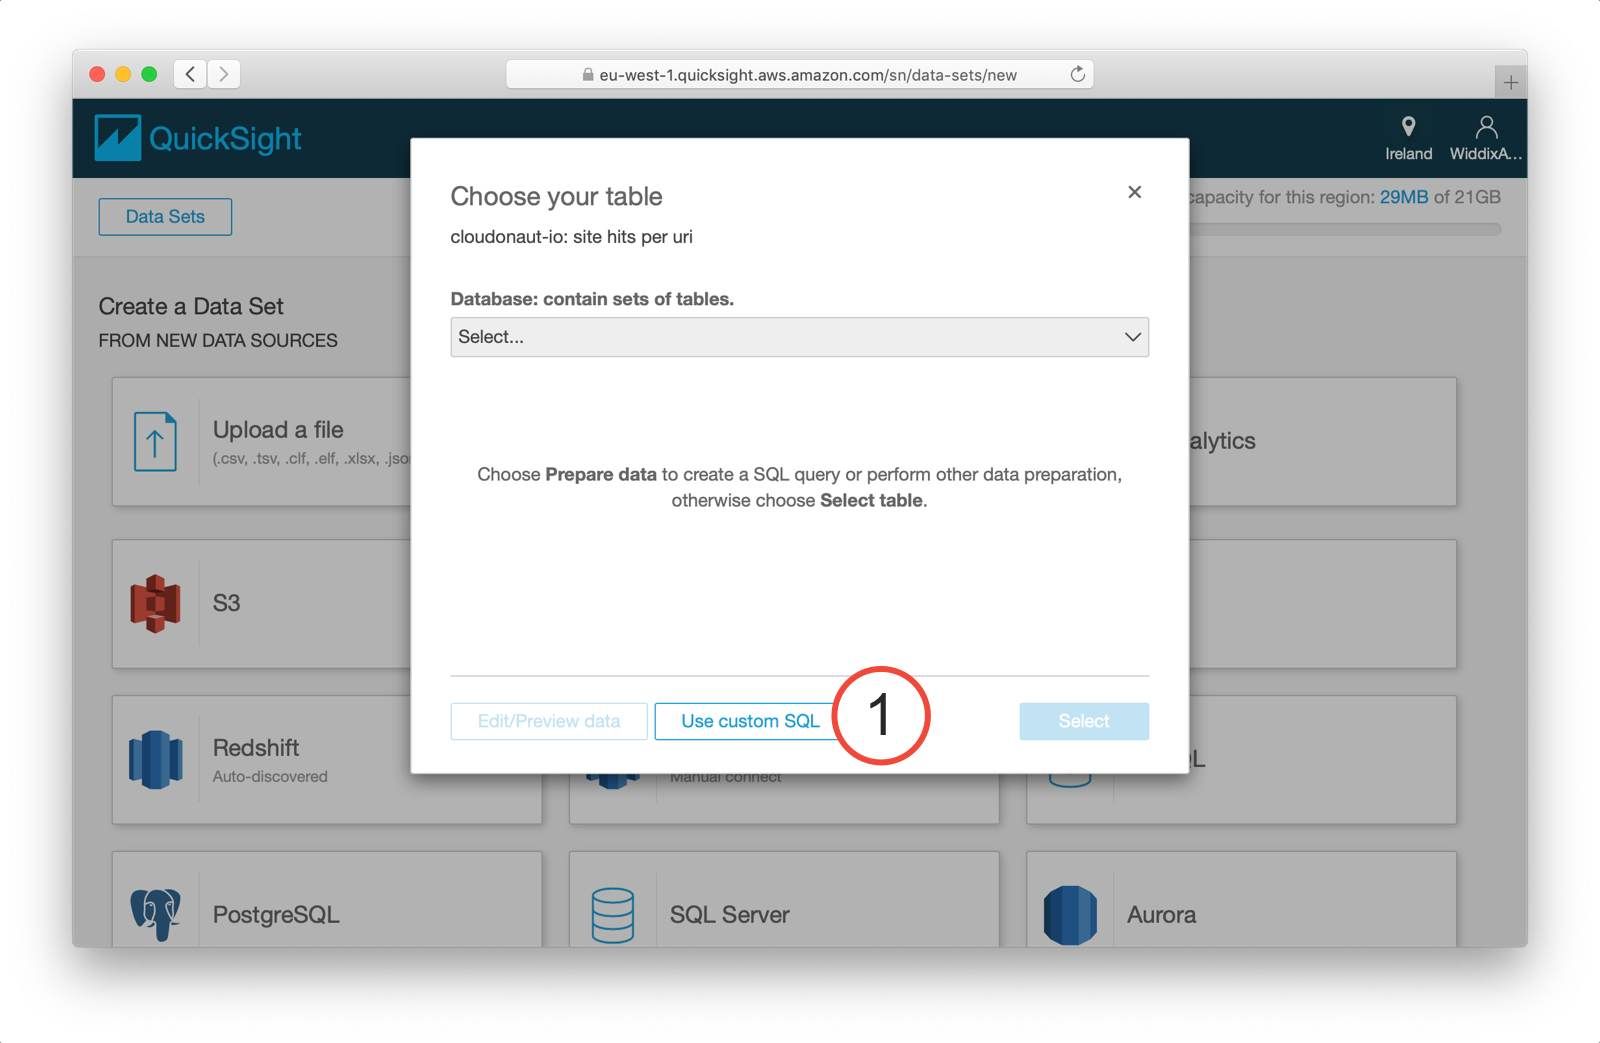
To make use of the custom queries you came up with in the previous section select Use custom SQL (1) in the following step of the wizard.
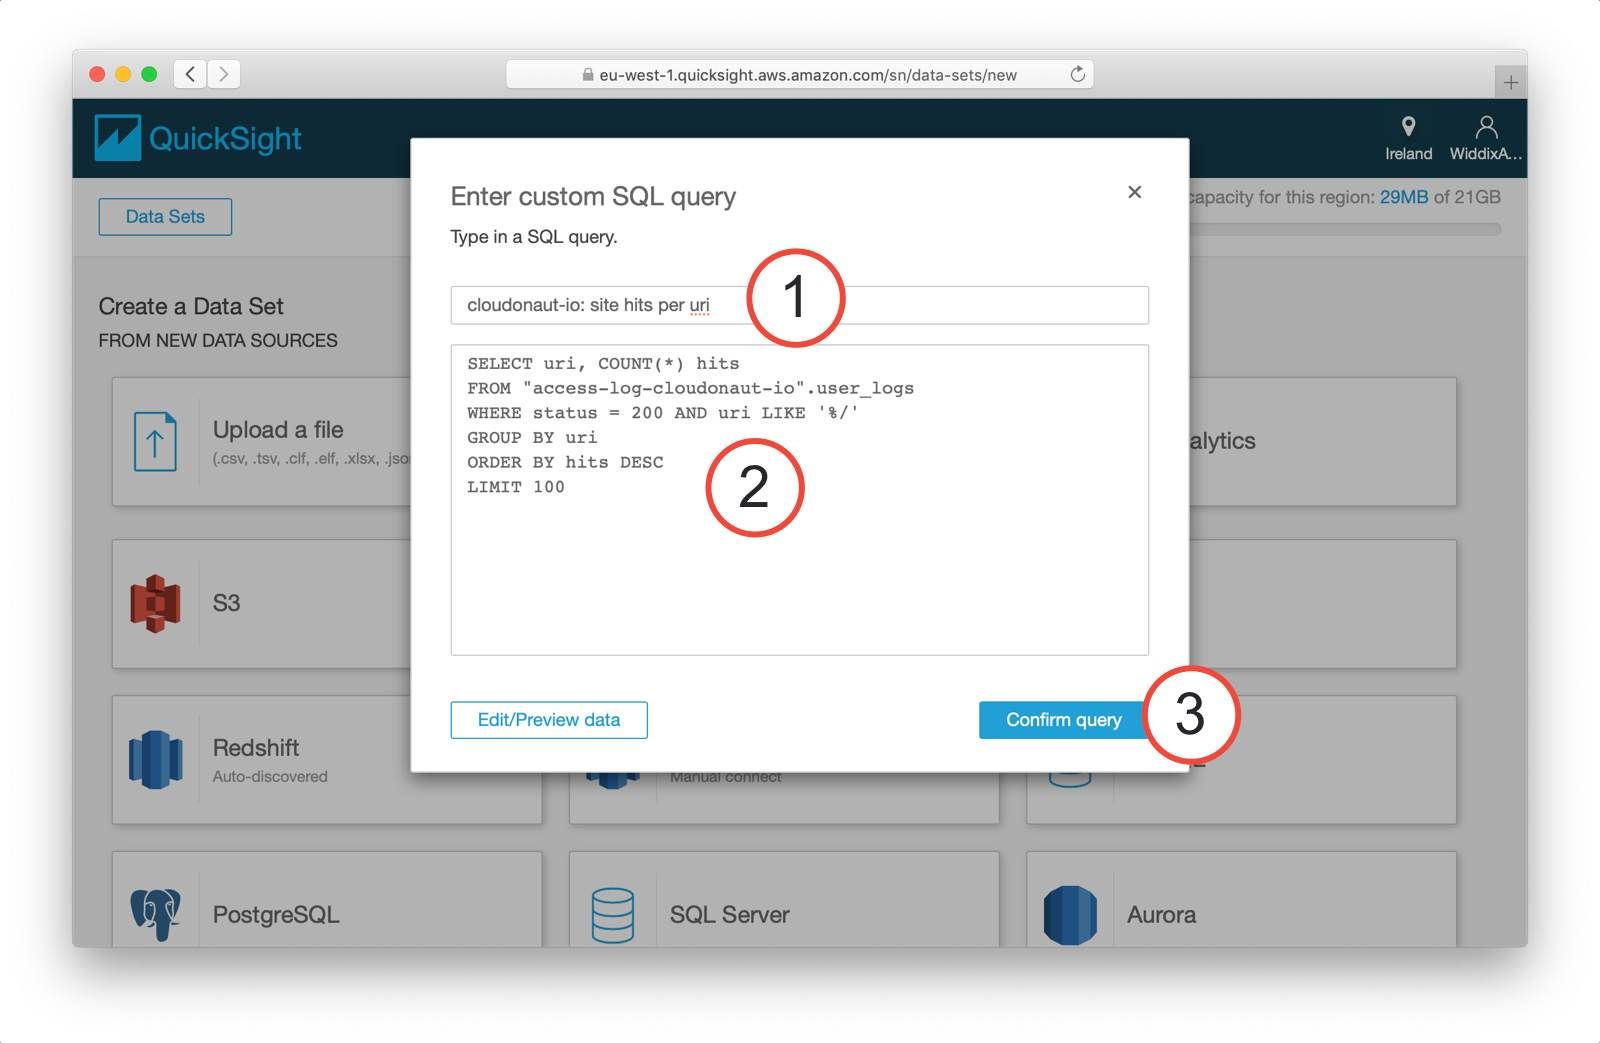
Next, you need to name the query (1), insert your SQL query (2), and click the Confirm query button (3).
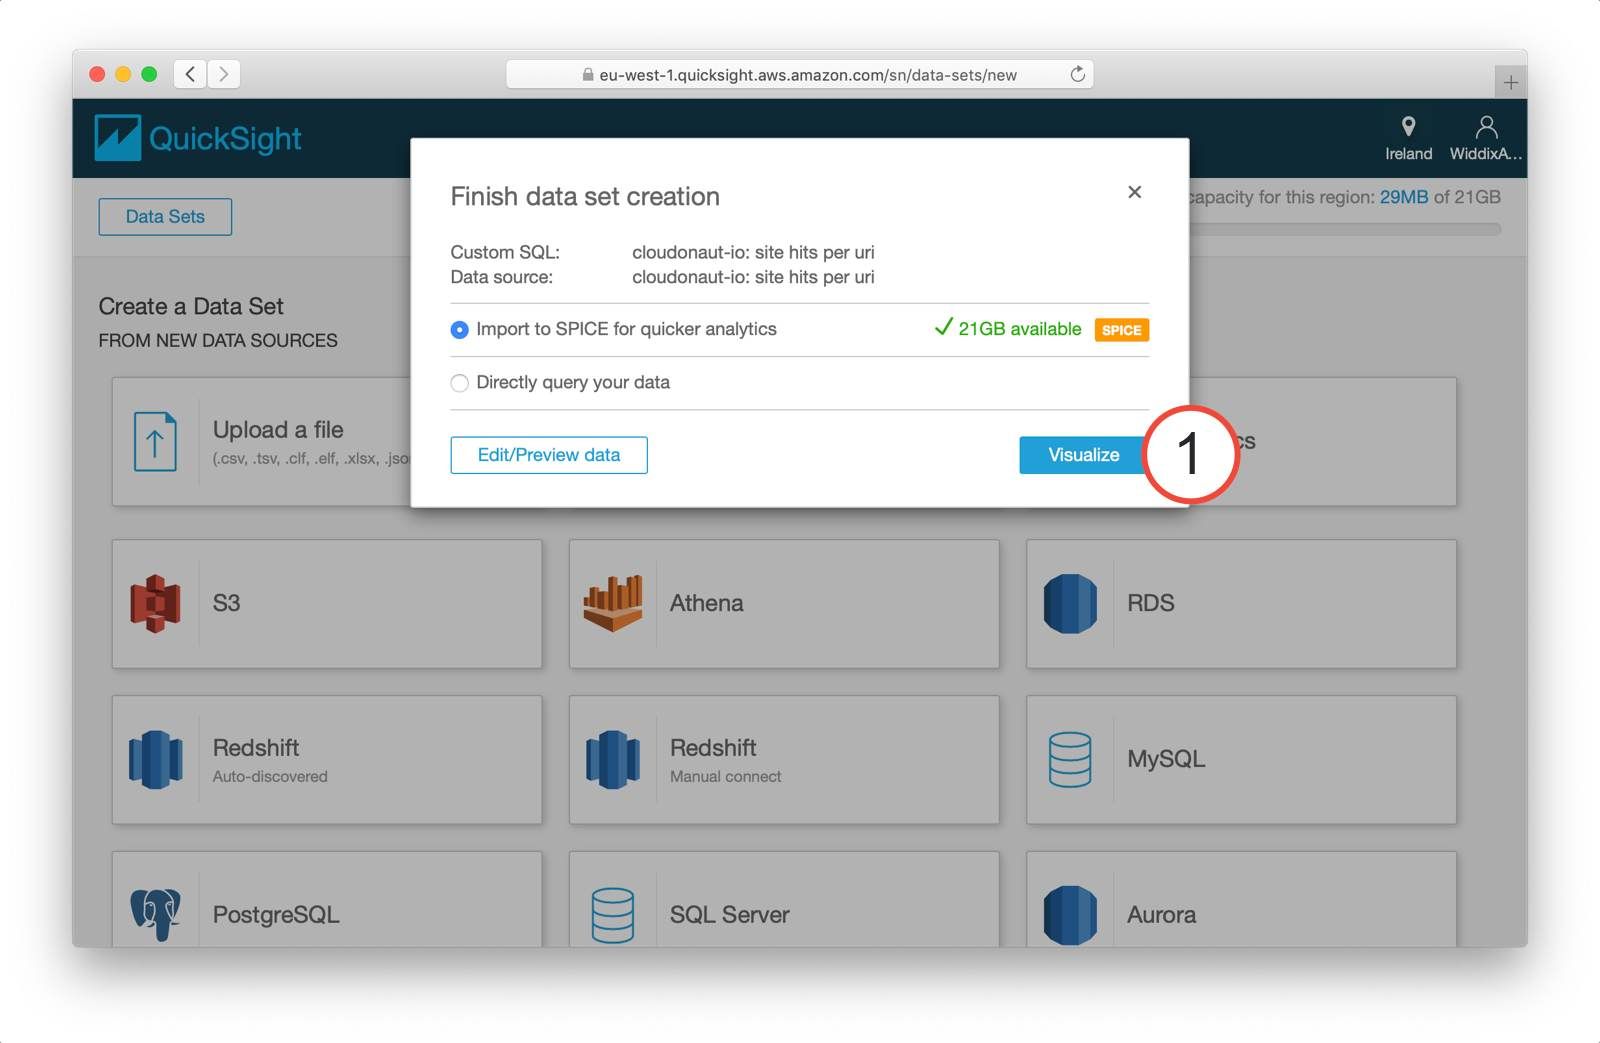
I recommend that you use SPICE to cache the query results from Athena. Doing so speeds up the visualizations and minimizes Athena costs. Continue with visualizing the data (1).
It is time to visualize your data now. To do so, drag the fields (1) to the chart pane and select the visual type (2).
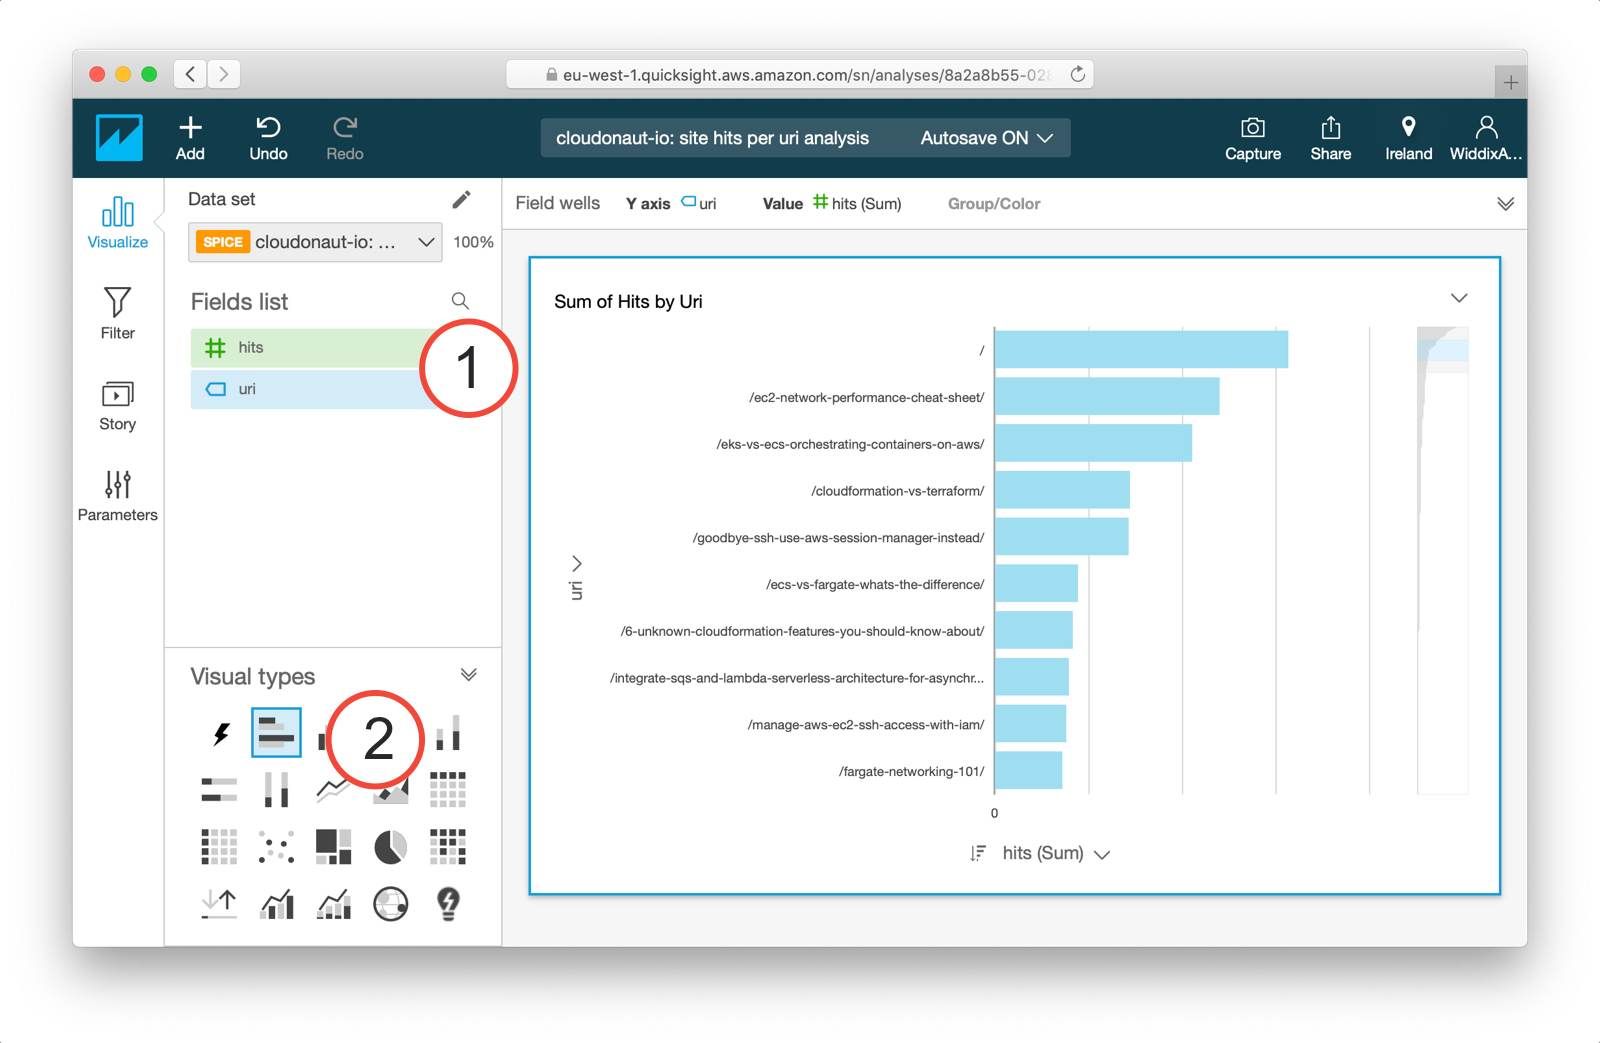
You have successfully created a data source as well as a visualization. You need to repeat the described process for each Athena query you want to visualize. The next steps are: creating an analysis consisting of multiple visualizations as well as sharing your analysis by creating a dashboard.
Estimated costs
The costs for the described analytics platform consist of the following items:
- S3: USD 0.023 per GB plus costs for read and write requests
- Athena: USD 5.00 per TB of data analyzed
- QuickSight: USD 9.00 per author per month for the Standard Edition (1 author is free)
For example, we are paying less than USD 10.00 per month for gaining insights into the user experience of you, the readers of this blog.
Summary
This blog is free of Google Analytics. Instead, I’m using S3, Athena and QuickSight to make data-driven decisions. For example, to decide which topics Michael and I should write about. The analytics solution does neither involve servers nor self-hosted applications. All three services are maintenance-free. But at the same time, the solution is extensible and gives me full control. Admittedly, the functionality of Google Analytics goes well beyond what I can achieve with based on the access logs. But for me, the possibilities are quite sufficient.
My plan for the future is to not only use access logs from CloudFront but to collect other kinds of events as well. I will keep you posted.
Further reading
- Article Analyzing CloudTrail with Athena
- Article Connecting Kinesis Analytics with AWS IoT
- Article Cloud adaption strategy: event-based data synchronization
- Tag s3
- Tag athena
- Tag quicksight
