Behind the scenes of the EC2 network performance benchmark
What is the maximum network throughput you can expect from an EC2 instance of type t2.large? How much does the network performance increase when switching from a t2.large to m5.large instance? All these kind of questions are hard to answer, as AWS does not disclose the network capacity of all their instance types in detail. Therefore, I ran a network performance benchmark with almost all instance types. The EC2 Network Performance Cheat Sheet shows a rough estimation of the network throughput you can expect from the different instance types.
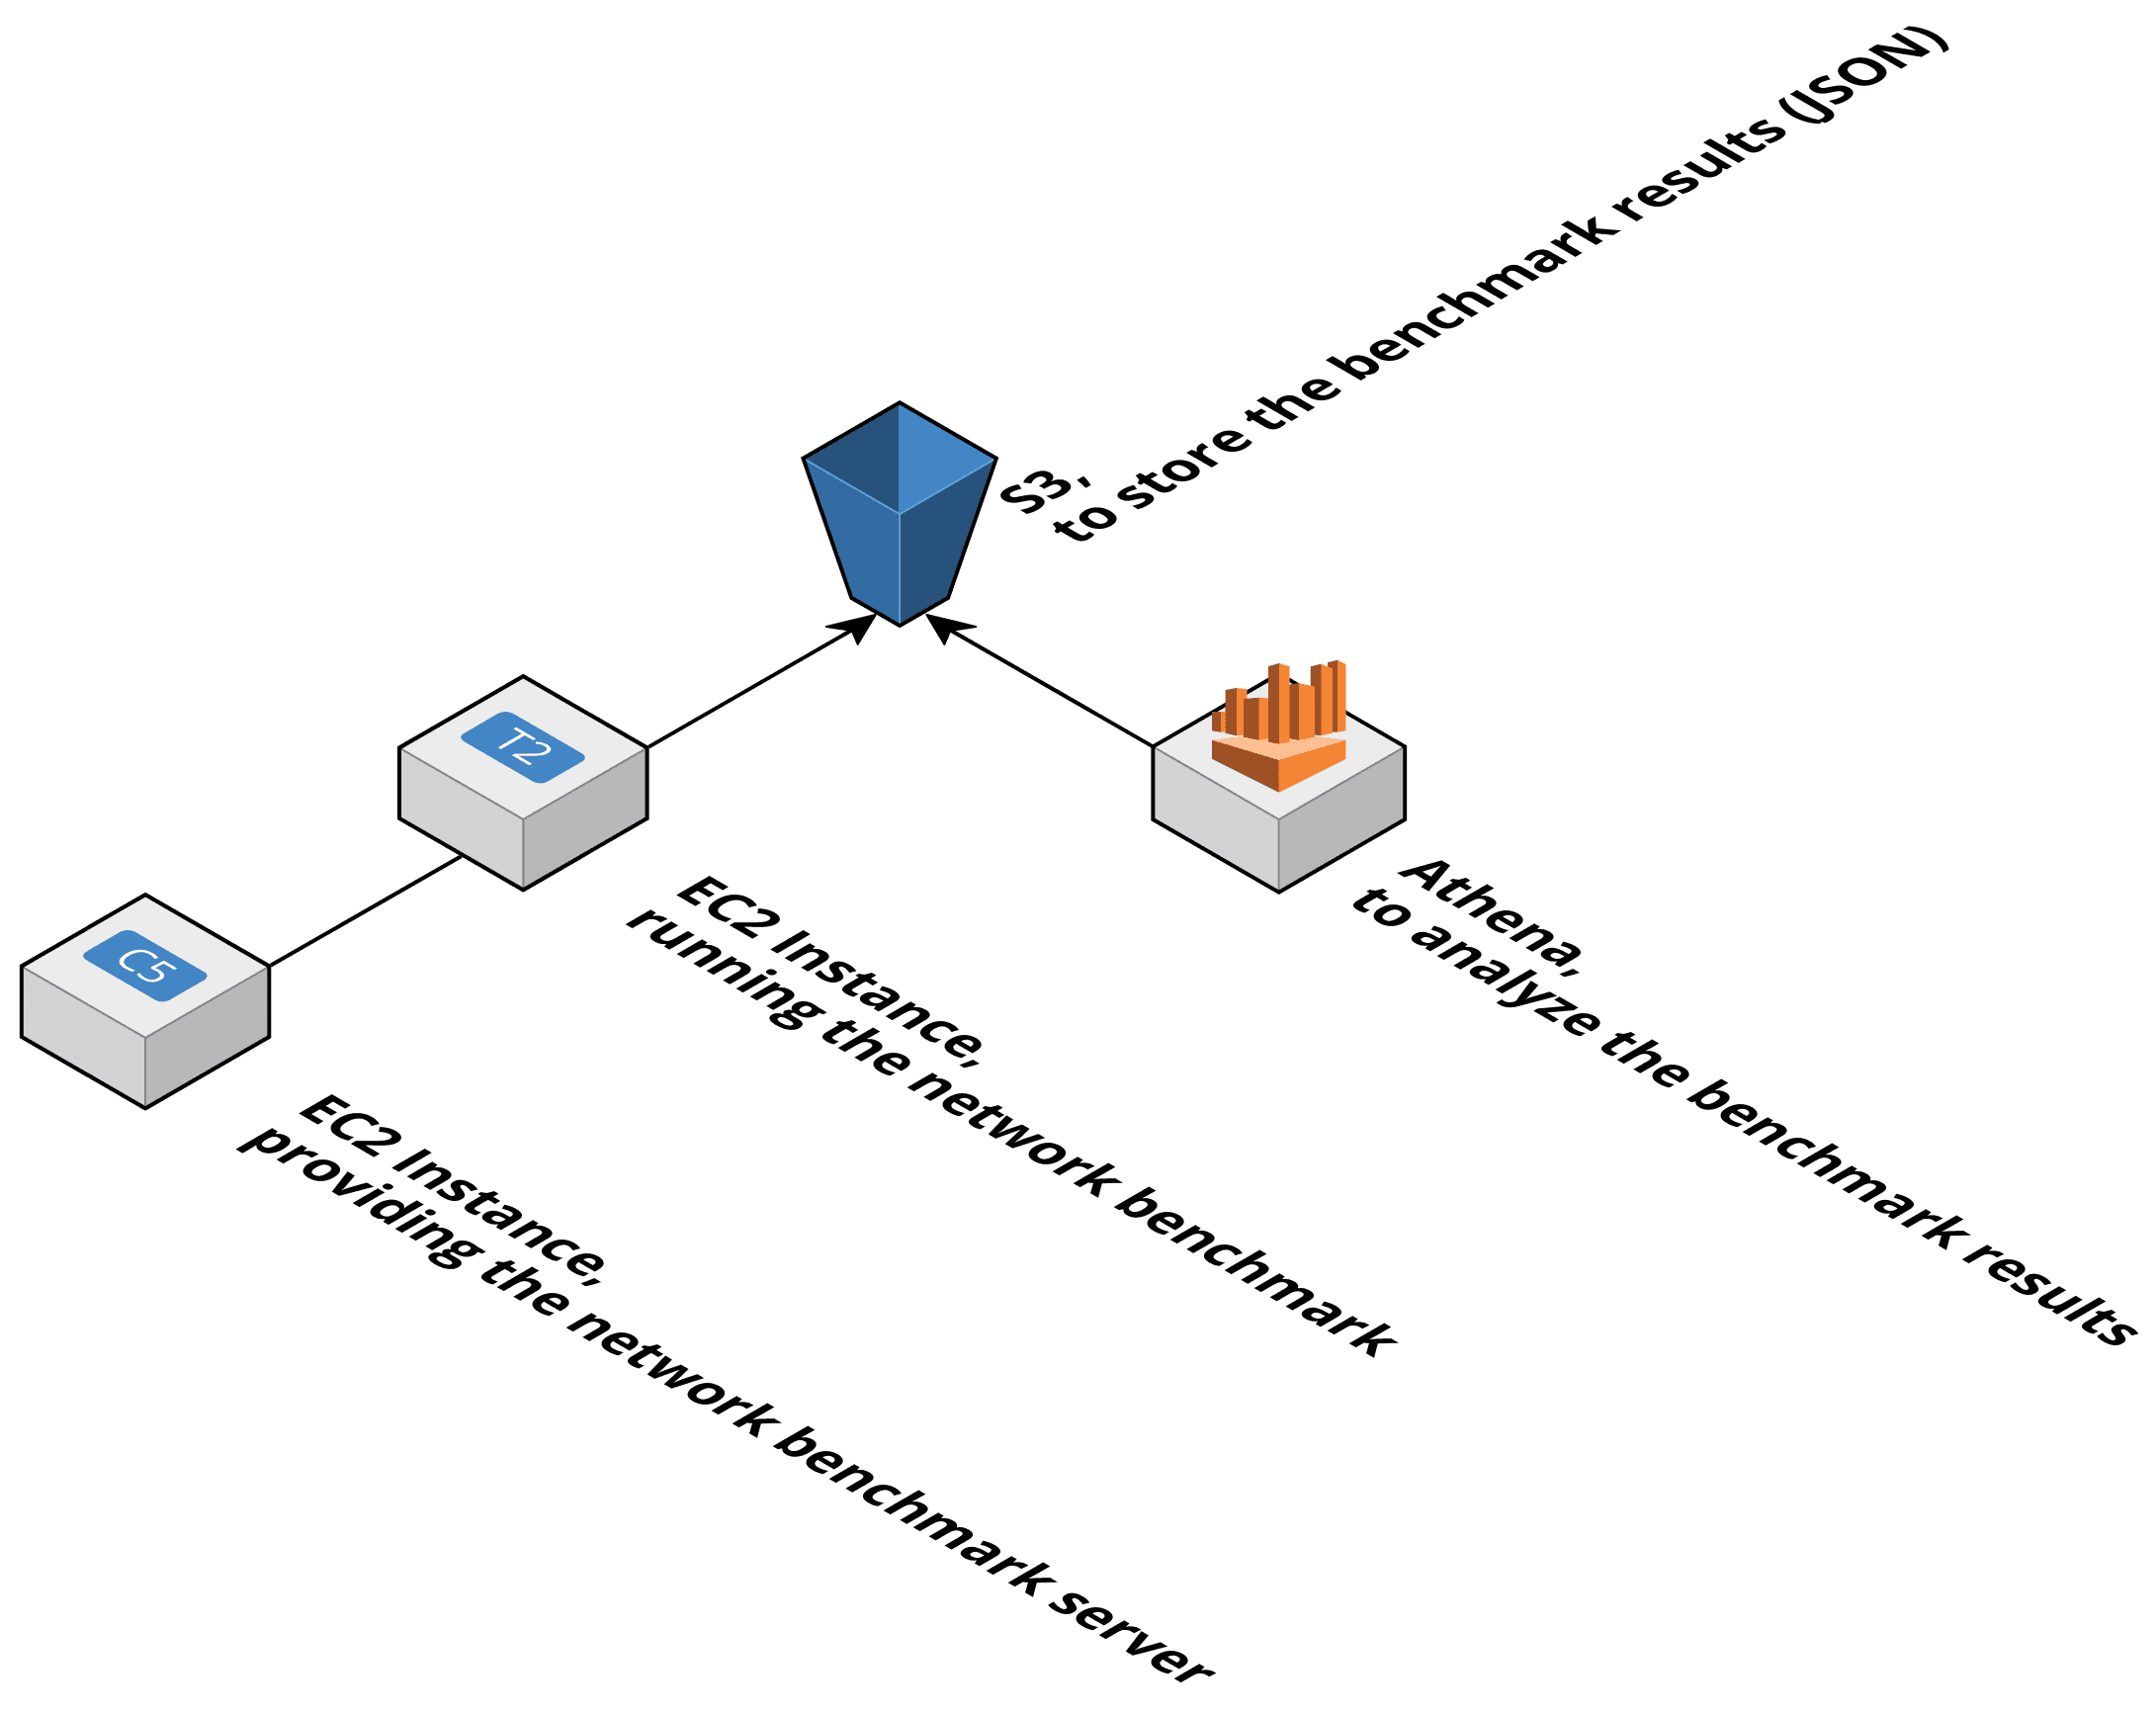
This blog post focuses on what I have learned while measuring the network capabilities of EC2 instances by using the following building blocks:
- EC2 to run the network benchmark.
- S3 to store the benchmark results.
- Athena to analyze the benchmark results.

EC2
After a little bit of research, I decided to use iperf3 a reliable speed test tool for TCP and UDP.
For testing the network performance of each instance type I have launched a c5.18xlarge and started iperf3 in server mode.
iperf3 -s |
Next, I have created an instance of the instance type under test and ran iperf3 in client mode. By default, iperf3 is using a single stream which is not enough to saturate the network throughput of many instance types. The option -P 10 does the trick by using 10 parallel streams.
iperf3 --client 10.0.0.10 --time 3600 --interval 60 --version4 --json -P 10 |
Did you know some instance types provide network burst? So, an instance can use a huge amount of network capacity, but only for a short period comparable to CPU burst of t2 instances.
Instance types that use the ENA and support up to 10 Gbps of throughput use network I/O credit mechanism to allocate network bandwidth to instances based on average bandwidth utilization. (AWS Documentation: Compute Optimized Instances)
I was not aware of that fact. Therefore, my first attempt measuring the network performance for only 60 seconds generated misleading results. To solve the problem, I had to re-run the network benchmark with a duration of 60 minutes (--time 3600) for each instance type. Generally speaking, you should run any load tests for at least 60 minutes to make sure you do not measure any burst capacities.
Furthermore, I have learned the hard way that spinning up a server and a client instance for 77 instance types is quite costly: 154 instance hours ranging from USD 0.0063 to USD 32.00 are definitely not covered by the Free Tier. :-D Switching from on-demand to spot instances reduced costs significantly. But some instance types are hardly available on the spot market (e.g., h1.2xlarge, d2.8xlarge, g3.8xlarge, …).
S3
To be able to analyze the benchmark results later, each client instance uploaded its results to S3. The --json flag tells iperf3 to generate a JSON output.
The following snippet shows an excerpt of a JSON file including the benchmark results of a t2.nano instance. For every interval - 60 seconds --interval 60 - iperf3 has captured a data point.
{ |
Compressing the benchmark results is a best practice to reduce the amount of storage needed on S3 as well as the amount of data that needs to be processed when analyzing the results.
To be able to query only a subset of the files later, I have used a key schema substituted by the date following by the instance type and a timestamp as illustrated in the following snippet.
d=2018-04-10/c4.2xlarge-1523348026.json.gz |
With the benchmark results stored on S3, there was only one step left: analyzing the data.
Athena
I have used Amazon Athena to query the benchmark results stored on S3. The first challenge was to create a table based on the JSON data structure.
The following statement creates a table with the following columns:
- region: the AWS region read from the first level of the JSON data structure
- instanceType: the instance type read from the first level of the JSON data structure
- intervals: which maps parts of the intervals array from the JSON data structure
CREATE EXTERNAL TABLE networkbenchmark ( |
To minimize the amount of data Athena needs to process, I have been using the date d as a partition for the table. Doing so is possible because all object keys start with d=2018-04-10.
Next, it is necessary to tell Athena to load all partitions for a table with the following statement.
MSCK REPAIR TABLE networkbenchmark; |
Finally, I was ready to analyze the data. However, querying the data was a little bit tricky, as the output from iperf3 of type JSON contains 60 data points, one data point per minute. To calculate the minimum, maximum, average, and 95th percentile, the query needed to flatten the nested array intervals. The following listing shows a simplified version of the JSON data.
{ |
Athena makes use of the presto query engine which allows expanding arrays into a relation with UNNEST.
The following query …
… aggregates bits_per_second for each instancetype and region.
… expands each item of the nested intervals array into its a relation.
… filters by date and the length of the intervals array cardinality(intervals).
SELECT |
Are you looking for more details on how to query arrays with Athena? Have a look at Querying Arrays.
Summary
Storing the network benchmark results on S3 and analyzing the data with Athena was convenient and flexible. The results of the network benchmark surprised me, more on that at EC2 Network Performance Cheat Sheet, EC2 network performance demystified: m3 and m4, and Evolution of the EC2 Network Performance: m3, m4, and m5. I have published the source code of the network benchmark at widdix/ec2-network-benchmark.
Further reading
- Article EC2 Network Performance Cheat Sheet
- Article Evolution of the EC2 Network Performance: m3, m4, and m5
- Article EC2 network performance demystified: m3 and m4
- Tag ec2
- Tag vpc
- Tag s3
